
by Ryan Greenaway-McGrevy
413
Cityscape: A Journal of Policy Development and Research • Volume 26, Number 2 • 2024
U.S. Department of Housing and Urban Development • Office of Policy Development and Research
Cityscape
Foreign Exchange
Foreign Exchange, a department of Cityscape, reports on what the U.S. Department of Housing
and Urban Development’s International and Philanthropic Affairs Division has learned about new
departures in housing and development policy in cities and suburbs throughout the world that might
have value if applied in U.S. communities. If you have a recent research report or article of fewer than
2,000 words to share in a forthcoming issue of Cityscape, please send a one-paragraph abstract to
Bradley.A.W[email protected].
Causes and Consequences of Zoning
Reform in Auckland
Ryan Greenaway-McGrevy
The University of Auckland
Abstract
In 2016, the city of Auckland, New Zealand, upzoned approximately three-quarters of residential land
to support medium- and high-density housing. This article describes the antecedents to this widespread
zoning reform, details the extent of the reform, and presents evidence of its subsequent impacts on the
city’s housing market. The amalgamation of municipal governments into a single jurisdiction was an
important precursor to the reform. Subsequent increases in housing starts indicate that the upzoning
had a substantial impact on housing construction, while changes in rents suggest that it significantly
decelerated increases in housing costs.
Introduction
Housing has become increasingly unaffordable in many cities around the world, leading a growing
chorus of researchers to call for widespread zoning reform as a means to redress housing shortages
and relieve upward pressure on housing costs (Glaeser and Gyourko, 2003; Freeman and Schuetz,
2017; Been et al., 2019; Manville et al., 2020). Proponents argue that binding land use regulations
constrain supply in areas of high demand, pushing housing costs up and people out. The corollary
is that relaxing those restrictions will allow housing supply to meet demand, thereby alleviating cost
pressures and allowing more households to access the opportunities available in prosperous cities.

Greenaway-McGrevy
414
Foreign Exchange
Scant empirical examples complement these theoretical arguments, however, because up until
very recently, few cities have pursued widespread zoning reform (Schill, 2005; Freeman and
Schuetz, 2017; Freemark, 2019).
1
However, in 2016, the city of Auckland, New Zealand, upzoned
approximately three-quarters of its residential-zoned land to varying degrees (Greenaway-McGrevy
and Jones, 2023). The city therefore provides a unique case study for policymakers seeking to
redress housing shortages and tackle unaffordable housing in other parts of the world. This article
describes the events preceding the reform, details the extent of the reform, and presents evidence
of its subsequent impacts on housing outcomes.
2
The amalgamation of several municipal authorities into a single jurisdiction for the entire
metropolitan region was an important antecedent to the reform, particularly when viewed through
the lens of canonical theories of urban political economy. Development has concentrated costs and
diffuse benefits that lead homeowners to oppose local development (Fischel, 2001), encouraging
low-density sprawl in metropolitan regions with fractured governance structures (Fischel, 2008).
Centralization of planning decisions to the metropolitan level ensures that the relevant negative and
positive externalities of development are internalized.
Housing market outcomes after the reform are consistent with upzoning increasing the supply and
reducing the cost of housing. As anticipated by proponents of upzoning, housing construction
has boomed subsequent to the reform, and rental price increases have decelerated, growing by
substantially less in Auckland than in other cities in New Zealand. Studies by the author and
collaborators that apply modern econometric policy evaluation methods suggest that these
effects are causal, meaning that they can be attributed to the reform rather than some concurrent
confounding event or policy change.
The remainder of the article is organized as follows. The next section describes the institutional
background leading up to the reforms, showing that centralization of decisionmaking featured
prominently in the institutional changes that preceded the reform. The third section summarizes
the scale and extent of the reform, and the fourth section describes changes in various housing
outcomes before and after the reform. The fifth section concludes.
Institutional Background and Antecedents to Zoning Reform
Auckland
Auckland is the largest metropolitan area in New Zealand, with an estimated resident population
of 1.7 million as of June 2023. Centered on a long isthmus between two harbors, the city
accounts for 38 percent of gross domestic product (GDP) and about one-third of the total
population of the country.
3
1
Houston is an exception, having implemented widespread reform in 1998 (Gray, 2022).
2
This article draws on various published and working papers by the author and his colleagues, including Greenaway-
McGrevy and Phillips (2023), Greenaway-McGrevy and Jones (2023), Greenaway-McGrevy (2023), and Greenaway-
McGrevy and So (2024).
3
See https://www.stats.govt.nz/information-releases/regional-gross-domestic-product-year-ended-march-2022/.

Causes and Consequences of Zoning Reform in Auckland
415
Cityscape
Like much of New Zealand, Auckland experienced rapid population growth in the years preceding
the reform. Between the 2006 and 2018 national censuses, the usually resident population of
the region increased by 20.4 percent. However, housing supply failed to keep up with demand.
Occupied dwellings increased by only 13.7 percent over the same period,
4
representing a shortfall
of almost 7 percent, and the average number of people per dwelling increased from 2.98 to
3.15. The median age increased from 33 to 34.7 years, suggesting that the increase in people per
dwelling was not driven by demographic or compositional shifts toward larger or more families.
5
Amalgamation Into a Single Jurisdiction
Prior to 2010, the Auckland region consisted of seven district and city councils, each responsible
for designing and implementing zoning regulations within its jurisdiction, and one regional
council.
6
These councils were amalgamated in November 2010 into a single authority, the
Auckland Council, by an Act of Parliament.
7
Reasons for amalgamation included the need for a
cohesive strategic direction for the region and, later, cost efficiencies from the centralization of
local government services and administration. Asquith, McNeill, and Stockley (2020) provide a
comprehensive discussion of the rationale and processes underpinning amalgamation.
8
The newly formed Auckland Council was statutorily required to produce a strategic spatial plan
for the region and to produce a consistent set of land use regulations. The “Auckland Plan” was
released in 2012.
9
Motivated in part by sustainable development, this strategic plan called for a
transition toward a more compact form of urban growth, directing the majority of population
growth to be housed within the existing urban area. The plan set a specific target of 60 to 70
percent of new dwellings to be built within the existing “metropolitan urban limit” that delineated
residential from rural areas.
10
The spatial plan was followed by the draft version of the Auckland
Unitary Plan (AUP), which included widespread relaxation of land use regulations to achieve the
strategic target.
4
Source: Author’s calculations based on data from Table 2 and Table 13 here: https://www.stats.govt.nz/assets/
Uploads/2018-Census-population-and-dwelling-counts/Download-data/2018-census-population-and-dwelling-counts-
amended-5-3-2020.xlsx.
5
Sources: https://statsnz.contentdm.oclc.org/digital/collection/p20045coll20/id/75/ and https://www.stats.govt.nz/
tools/2018-census-place-summaries/auckland-region.
6
An earlier consolidation had combined 29 local authorities into the seven councils in 1989.
7
The Local Government (Auckland Council) Act 2009. https://www.legislation.govt.nz/act/public/2009/0032/latest/
DLM2044909.html.
8
The 2011 Rugby World Cup, hosted by New Zealand, was an important catalyst. The government established a Royal
Commission on Auckland Governance after the Minister for the Rugby World Cup failed to attain agreement among the
various councils on a new and largely central government-funded stadium (Asquith, McNeill, and Stockley, 2020). The
commission recommended amalgamation.
9
https://www.aucklandcouncil.govt.nz/plans-projects-policies-reports-bylaws/our-plans-strategies/Documents/auckland-
plan-2012-full-document.pdf.
10
The Auckland Plan 2012, paragraph 88, pp. 36–37, and p.48, paragraphs 124–129.

Greenaway-McGrevy
416
Foreign Exchange
The Auckland Unitary Plan
The draft version of the plan was publicly released in March 2013 and was followed by 11 weeks
of public consultation and feedback. Auckland Council then released the Proposed Auckland
Unitary Plan (PAUP) in September.
However, prior to public notification of the PAUP, Auckland Council proposed that the
central government appoint an Independent Hearings Panel (IHP) to take public submissions
and recommend changes to the PAUP. The additional front-end community engagement
would substitute for limited rights of appeal to IHP recommendations, thereby accelerating
implementation by avoiding lengthy litigation (Blakeley, 2015). The central government agreed to
the request and amended the facilitating legislation.
11
The IHP held hearings between April 2014 and May 2016 before releasing recommended
changes to the PAUP on July 22, 2016. The IHP recommendations included further relaxation of
restrictions to enable medium- and high-density housing, such as the abolition of minimum lot
and dwelling sizes.
Auckland Council then voted on IHP recommendations over the next 20 working days,
maintaining the abolition of minimum lot sizes but voting down the recommended removal of
minimum dwelling sizes. The Council subsequently released the “decisions” version of the AUP
in August. This release was followed by a 20-day period for the public to lodge appeals in the
Environment Court. Appeals to the High Court were only permitted if based on points of law. The
AUP then became operative in part on November 15, 2016.
12
Each step in the process was highly transparent. Spatial plans for each version of the AUP could
be viewed online by the public, along with the new regulations that would potentially change
restrictions on permissible site development. This transparency meant that any interested member
of the public could assess how zoning might affect what could be built on any given parcel under
the proposed zoning changes.
The Auckland Housing Accord
Although the AUP became operative in November 2016, an interim agreement between Auckland
Council and the central government allowed developers to access the relaxed land use regulations
of the PAUP soon after its notification.
In September 2013, the central government passed inclusionary housing legislation that offered
developers an accelerated building approval process in return for the provision of affordable
housing within the development.
13
These developments were called Special Housing Areas (SHAs).
11
Local Government (Auckland Transitional Provisions) Amendment Act 2013. https://www.legislation.govt.nz/act/
public/2013/0064/latest/DLM5464006.html.
12
Only two elements were not operative at this time: (a) any parts that remained subject to the Environment Court and
High Court; and (b) the regional coastal plan of the Proposed AUP that required Minister of Conservation approval.
13
The “Housing Accords and Special Housing Areas Act 2013” (HASHAA). See https://www.legislation.govt.nz/act/
public/2013/0072/latest/DLM5369001.html.

Causes and Consequences of Zoning Reform in Auckland
417
Cityscape
To qualify for the program, developers were required to allocate 10 percent of dwellings to
affordable housing.
14
At the same time, Auckland Council and the central government also entered into the Auckland
Housing Accord (AHA), an agreement that allowed SHA developments in Auckland to be built
according to the more relaxed regulations of the PAUP.
15
The Accord stipulated that the program
would expire once the AUP became operative. By the time the program ended, more than 150
SHAs had been approved in Auckland.
16
The total number of dwellings generated under the program was comparatively small.
17
Nonetheless, the policy likely had an impact on state-developed housing, which began to increase
substantially from 2013 onward. Fernandez et al. (2021) present evidence that the SHA program
in Auckland largely failed to meet affordable housing requirements, partly because of a lack of
enforcement mechanisms.
Antecedents to Reform
The amalgamation of the seven city and district councils in 2010 was likely a critical antecedent to
the widespread zoning reform that would follow. Political theories of urban development, such as
Fischel’s “homevoter hypothesis,” posit that urban development has concentrated costs but diffused
benefits, leading homeowners to oppose nearby development (Fischel, 2001) and causing regions
with more fractured governance structures to have tighter restrictions on housing supply (Fischel,
2008). Amalgamation into a single authority for an entire metropolitan area presents a potential
solution to optimally balance the externalities of development because it centralizes planning
decisions to the level where the relevant costs and benefits are internalized. Empirical evidence from
other contexts supports this reasoning. For example, Tricaud (2021) finds that fractured regions in
France that were forced to integrate subsequently experienced increases in housing construction.
Centralization of planning decisions also features prominently in the implementation of
Auckland’s zoning reform through Auckland Council asking the central government to appoint the
Independent Hearings Panel. Although motivated by a desire for streamlined implementation, this
further removed planning decisions from the policymakers adjacent to local politics.
However, although amalgamation may have proven a sufficient antecedent to reform, sufficiency
does not imply necessity. Alternative options exist.
14
Affordable housing was defined as housing meeting at least one of two criteria. First, the dwelling price did not exceed 75
percent of the Auckland region median house price. Second, the dwelling was (a) sold or rented to a household earning
up to 120 percent of the median household income for Auckland and (b) sold or rented at or below a price at which
the household spent no more than 30 percent of its gross household income on rent or mortgage payments. In addition,
purchasers were also asked to occupy the affordable house exclusively as their residence for no less than 3 years and to be a
first-time homebuyer. Developments had to have a minimum of 14 units to qualify. See Fernandez et al. (2021).
15
https://www.beehive.govt.nz/sites/default/files/Auckland_Housing_Accord.pdf.
16
An exhaustive list of SHAs is available at https://infocouncil.aucklandcouncil.govt.nz/Open/2017/10/PLA_20171010_
AGN_6726_AT_files/PLA_20171010_AGN_6726_AT_Attachment_55947_1.PDF.
17
Monitoring reports subsequently kept track of the number of new dwelling permits issued. The Auckland Housing Accord Third
Quarterly Report for Third Accord Year estimated that 2,208 permits had been issued in SHAs between October 2013 and June
2016. See https://www.beehive.govt.nz/sites/default/files/Auckland%20Housing%20Accord%20Monitoring%20Report.pdf.

Greenaway-McGrevy
418
Foreign Exchange
Upzoning may be more politically acceptable if neighborhoods are allowed to collectively opt out,
which occurred in Houston (Martin, 2023). Direct monetary incentives from a central or state
government to construct dwellings could help overcome municipal opposition (Ehrlich, Hilber,
and Schöni, 2018). Reforming land use institutions to facilitate bargaining between developers and
neighborhoods would enable residents to be compensated for bearing the negative externalities
of development (Foster and Warren, 2022). Finally, adopting a more active and representative
community consultation process may help redress self-selection biases inherent to voluntary
community consultation. Lower Hutt, a municipal government within the Wellington metropolitan
region of New Zealand, features consultation with a representative citizens’ panel in its decision-
making process. Two-thirds of panel members supported medium-density reforms (Maltman and
Greenaway-McGrevy, 2024).
Zoning Changes
The Auckland Unitary Plan introduced four new zones for residential areas.
18
Listed in decreasing
order of permissible site development, these zones are Terrace Housing and Apartment Buildings
(THA), Mixed Housing Urban (MHU), Mixed Housing Suburban (MHS), and Single House (SH).
Exhibit A-1 in the appendix summarizes the various regulations for each zone, including site
coverage ratios, height restrictions, setbacks, and recession planes. Five to seven stories and a
maximum site coverage ratio of 50 percent are allowed in THA, three stories and a coverage ratio of
45 percent are allowed in MHU, and two stories and a coverage ratio of 40 percent are allowed in
MHS. Up to three dwellings per parcel are allowed in MHS and MHU, with no restriction applying
to THA. Meanwhile, the Single House zone is reserved for conventional low-density detached
housing, allowing one dwelling per parcel, two stories, and a maximum site coverage ratio of 35
percent. The THA, MHU, and MHS zones cover 7.3, 22.6, and 45.1 percent of residential parcels,
respectively, with the remaining 25 percent allocated to SH.
19
Prior to the zoning reform, approximately 95 percent of residential-zoned land had restrictions
similar to that of the Single House zone.
20
Changes in floor-area ratios implied by height and site
coverage restrictions indicate that approximately three-quarters of residential land was upzoned
(Greenaway-McGrevy and Jones, 2023).
Exhibit 1 depicts the geographic distribution of upzoned residential areas by zone. The plan
allowed more intensive development around access points to public and private transit networks.
Many of the inner suburbs immediately surrounding the central business district were zoned
Single House and were protected by special character “overlays” that prevent teardown and
replacement of the houses. These suburbs largely consist of houses constructed in the late 19th
and early 20th centuries.
18
The AUP also includes two additional zones that were described as “residential” that were applied to peri-urban areas or
small settlements distant to the CBD: “Large Lot” and “Rural and Coastal Settlement.” Regulations in these zones restrict
development to a very low intensity, and connection to water and sewerage infrastructure is frequently lacking.
19
Source: Author’s calculations based on Table 1 of Greenaway-McGrevy and Jones (2023).
20
Prior to the AUP, there were more than 100 different residential zones across the seven city and district councils.
Medium- and high-density housing in residential areas was restricted to small pockets. See Table 1 in Greenaway-McGrevy
and Jones (2023).

Causes and Consequences of Zoning Reform in Auckland
419
Cityscape
Exhibit 1
Upzoned and Non-Upzoned Residential Areas of Auckland
Notes: CBD = central business district. MHS = Mixed Housing Suburban. MHU = Mixed Housing Urban. THA = Terrace Housing and Apartment Buildings. Rapid
Transit stations include heavy rail stations, dedicated busway stations, and ferry terminals. The CBD marker is centered on the iconic “Sky Tower” skyscraper in
the central business district. Water is shown in gray. Residential areas upzoned to business and rural areas upzoned to residential or business are excluded for
visual clarity. See Greenaway-McGrevy and Jones (2023) for tabulations of land conversion between zones.
Source: Greenaway-McGrevy and Jones, 2023
Policy Effects
Subsequent changes in housing construction and housing costs indicate that the zoning reform had
had a substantial effect on the quantity and price of housing in the region.

Greenaway-McGrevy
420
Foreign Exchange
Housing Construction
In New Zealand, the building process begins with an application for a building consent—similar to
a building permit in the United States or a building approval in Australia. Consent is the primary
measure of construction activity used in the country. Historically, between 90 and 95 percent of all
issued consents result in finished dwellings.
21
Hereafter, this article will use the North American
term, permit.
Since the reform became operative in late 2016, Auckland has issued permits for approximately
112,000 new dwellings over the subsequent 7 years (2017 through 2023). To put that figure in
context, Statistics New Zealand estimates that Auckland’s housing stock totaled 530,000 dwellings
by the end of 2016. Thus, within 7 years, Auckland issued permits equivalent to more than one-
fifth (21 percent) of its existing housing stock.
22
Exhibit 2 shows annual permits issued for new dwellings in the Auckland region between 1991,
when the available data begin, and 2023. Dwelling permits reached record highs subsequent to the
reform in both absolute and per capita terms.
Prior to notification of the Proposed AUP in 2013, annual permits peaked in 2002 at 12,200
dwellings, or 9.7 permits per thousand residents. This early 2000s boom was driven in part by
construction of apartment buildings in the central business district (Productivity Commission,
2015). The abrupt end of the boom in 2005 coincided with a downzoning that imposed minimum
dwelling sizes on apartments.
Construction activity continued to decrease through the period spanning the global financial crisis
(GFC) and the associated global recession. Permits per thousand residents reached a low of 2.5 in
2009, thereafter recovering slightly.
Permits increased each year from 2013 through to 2022, first reaching a new record of 12,800
units in 2019, just 3 years after the reform became operative. In per capita terms, a new record
of 9.7 permits per thousand residents was also attained in 2019, followed by further increases in
2021 and 2022, when it reached a record high of 12.6.
21
“Code of compliance certification” (CCC) is commonly used as a measure of building completions in New Zealand. CCCs
indicate that the building works have been satisfactorily inspected by the local council to certify that the work has been
completed to the required local and national building codes and regulations. Experimental estimates of completion rates for
New Zealand as a whole produced by Statistics New Zealand (SNZ) exceed 90 percent. For example, using CCC issuance
as completion results in a 91.2 percent completion rate for permits issued over the 10 years to December 2018. However,
dwellings can be inhabited without a CCC. Final inspection provides another measure of completion because it occurs after
the dwelling is completed to a habitable standard, with the interior wall linings, plumbing, and fixtures in place. Using
final building inspection results in a completion rate of 92.9 percent over the 10 years to December 2018. For further
information on SNZ experimental estimates, see https://www.stats.govt.nz/experimental/experimental-building-indicators-
march-2022-quarter.
22
This number is not the net increase in the housing stock, due to teardowns and uncompleted dwellings; it nonetheless
serves to illustrate the size of the supply response.

Causes and Consequences of Zoning Reform in Auckland
421
Cityscape
Permits then fell between 2022 and 2023, following an unprecedented rise in interest rates and
a technical recession.
23
Despite the unfavorable macroeconomic conditions, over 15,000 permits
were issued in 2023, far exceeding the peak of the previous cycle in 2002.
Exhibit 2
New Dwelling Permits in Auckland, 1991 through 2023
1990 1995 2000 2005 2010 2015 2020 2025
0
5
10
15
20
Reform
Partial Reform
Permits (1000s)
Year
1990 1995 2000 2005 2010 2015 2020 2025
Year
0
2
4
6
8
10
12
14
16
Reform
Partial Reform
Permits per 1000 residents
Notes: “Partial Reform” refers to the Auckland Housing Accord, which was enacted in October 2013 and allowed developers to build under the relaxed
regulations of the Proposed Auckland Unitary Plan in exchange for a 10-percent affordable housing provision. “Reform” refers to when the Auckland Unitary Plan
was made operative in November 2016.
Source: Statistics New Zealand
If the observed increases in permits subsequent to the reform were driven by upzoning, housing
construction should have occurred in upzoned areas of the city. Individual permit data maintained
by Auckland Council are geocoded so that they can be mapped to upzoned and non-upzoned
areas. Exhibit 3 demonstrates that the increase in housing starts from about 2015 onward is
driven exclusively by permits issued in upzoned areas, whereas permits in non-upzoned areas are
relatively stable from 2015 through 2022.
23
The Research Bank of New Zealand (the country’s central bank) increased the official cash rate from 0.25 percent in
September 2021 to 5.5 percent by May 2023. Meanwhile, national GDP growth was negative in the December 2022,
March 2023, and September 2023 quarters. At the time of writing, GDP growth for the December 2023 quarter had not
been released.

Greenaway-McGrevy
422
Foreign Exchange
Exhibit 3
Permits by Upzoned and Non-Upzoned Areas of Auckland, 2000 through 2022
2000 2002 2004 2006 2008 2010 2012 2014 2016 2018 2020 2022
0
2
4
6
8
10
12
14
16
18
20
New dwelling permits (thousands)
Reform
Partial Reform
Non-Upzoned Residential, Business, and Rural Areas
Upzoned Residential and Business Areas
Notes: “Partial Reform” refers to the Auckland Housing Accord, which was enacted in October 2013 and allowed developers to build under the relaxed
regulations of the Proposed Auckland Unitary Plan in exchange for a 10-percent affordable housing provision. “Reform” refers to when the Auckland Unitary Plan
was made operative in November 2016.
Source: Greenaway-McGrevy, 2023
Meanwhile, housing construction has shifted away from predominantly detached housing to
attached housing that medium- and high-density zones encourage. Exhibit 4 shows that, from
2019 on, more permits were issued for attached housing than for detached housing in the
Auckland region.

Causes and Consequences of Zoning Reform in Auckland
423
Cityscape
Exhibit 4
Permits by Attached and Detached Housing, 2000 through 2022
2000 2002 2004 2006 2008 2010 2012 2014 2016 2018 2020 2022
0
2
4
6
8
10
12
14
16
18
20
New dwelling permits (thousands)
Reform
Partial Reform
Detached
Attached
Notes: “Partial Reform” refers to the Auckland Housing Accord, which was enacted in October 2013 and allowed developers to build under the relaxed
regulations of the Proposed Auckland Unitary Plan in exchange for a 10-percent affordable housing provision. “Reform” refers to when the Auckland Unitary Plan
was made operative in November 2016. Attached housing includes apartments, rowhouses, and plexes.
Source: Greenaway-McGrevy and Jones, 2023
Since the reform was implemented, housing construction in Auckland has also outperformed
that of other large cities in New Zealand. Exhibit 5 plots permits per thousand residents (or the
“permitting rate”) in Auckland against other urban areas of the country that are large enough to be
classified as “metropolitan” by Statistics New Zealand.
24
Auckland exhibited a comparatively low permitting rate in the aftermath of the global financial
crisis (GFC), from 2008 to 2010, when permits per thousand residents bottomed out at 2.5 in
2009. A significant increase occurred between 2012 and 2013, when the partial upzoning under
the Auckland Housing Accord took place, followed by further increases every year thereafter
24
This article uses “functional urban areas” (FUAs) as the geographic unit of analysis to facilitate comparisons between
different cities, because administrative boundaries do not encompass metropolitan areas in cities other than Auckland.
FUAs are defined by Statistics New Zealand (SNZ) based on commuting patterns and are equivalent to commuting zones as
defined by the OECD. The metropolitan area of Christchurch is omitted as a relevant comparator because it experienced a
large and destructive earthquake in 2011 that had a significant impact on subsequent housing construction due to the need
to replace the loss in the housing stock.

Greenaway-McGrevy
424
Foreign Exchange
through 2022, when the permitting rate reached the record high of 12.6 permits per thousand
residents. Auckland’s permitting rate surpassed that of Tauranga in 2019, which had previously
exhibited the highest permitting rate among the five metropolitan areas.
Auckland continues to outperform the Wellington urban area despite one of the constituent
municipalities within the metropolitan area, Lower Hutt, implementing a sequence of widespread
zoning reforms in the late 2010s. Beginning in 2016, Lower Hutt enacted a series of zoning
changes to enable medium-density housing. However, Maltman and Greenaway-McGrevy (2024)
show that these zoning changes increased permits per capita in Lower Hutt to levels comparable to
those in Auckland.
Exhibit 5
Auckland’s Permits per 1,000 Residents Versus Other Cities in New Zealand, 1991 through 2022
1995 2000 2005 2010 2015 2020
Year
0
5
10
15
20
25
Permits Per Thousand Residents
Reform
Partial Reform
Auckland
Hamilton
Tauranga
Wellington
Dunedin
Notes: “Partial Reform” refers to the Auckland Housing Accord, which was enacted in October 2013 and allowed developers to build under the relaxed
regulations of the Proposed Auckland Unitary Plan in exchange for a 10-percent affordable housing provision. “Reform” refers to when the Auckland Unitary Plan
was made operative in November 2016.
Source: Greenaway-McGrevy, 2023
By 2021, the number of permits per capita in Auckland also surpassed that of large Australian
cities. Exhibit 6 compares Auckland’s permitting rate to that of Sydney, Melbourne, and Brisbane.
These three Australian cities exhibited far higher construction rates than Auckland after the latter’s
Causes and Consequences of Zoning Reform in Auckland
425
Cityscape
2005 downzoning and the GFC. By 2019, Auckland’s permitting rate exceeded that of Sydney and
Brisbane. By 2021, it surpassed that of Melbourne.
Exhibit 6
Auckland’s Permits per 1,000 Residents Versus Large Cities in Australia, 2002 through 2022
2002 2004 2006 2008 2010 2012 2014 2016 2018 2020 2022
Year
0
5
10
15
20
25
Permits Per Thousand Residents
Reform
Partial Reform
Auckland
Brisbane
Melbourne
Sydney
Notes: “Partial Reform” refers to the Auckland Housing Accord, which was enacted in October 2013 and allowed developers to build under the relaxed
regulations of the Proposed Auckland Unitary Plan in exchange for a 10-percent affordable housing provision. “Reform” refers to when the Auckland Unitary Plan
was made operative in November 2016.
Source: Greenaway-McGrevy, 2023
Causal Effects
The evidence presented in exhibits 2 through 5 appears consistent with widespread upzoning
having a large and significant impact on housing starts. Since passing the reform in late 2016—
1. Approximately 112,000 new dwelling permits have been issued over the subsequent 7 years
(2017 through 2023), equivalent to 21 percent of the prereform housing stock.
2. Dwelling permits issued per year have reached record highs in both absolute and per capita terms.
3. The increase in permits has been located exclusively in upzoned areas of the city.

Greenaway-McGrevy
426
Foreign Exchange
4. Attached housing accounts for the majority of new dwelling permits.
5. The number of permits per capita in Auckland has exceeded that of comparable cities
elsewhere in New Zealand and Australia.
However, evaluating the impact of the reform requires a counterfactual scenario that tells us what
would have happened if the policy had not been implemented. Quasi-experimental methods
are commonly employed to specify a counterfactual and measure policy effects. In the zoning
literature, quasi-experimental methods have been applied to study the effects of zoning changes in
Chicago (Freemark, 2019), Portland (Dong, 2021), and Minneapolis.
25
Synthetic controls provide one such quasi-experimental method. Under this approach, the
counterfactual is constructed from a weighted average of outcomes from comparable cities; the
weights are selected via a statistical algorithm to ensure that the weighted average (or synthetic
unit) has outcomes that resemble those of the treated unit prior to the policy change or
intervention. The synthetic unit then provides the policy counterfactual to the unit that received
the treatment. The synthetic control method has been applied to evaluate numerous policies and
was recently described by Susan Athey and Nobel Memorial Laureate Guido Imbens as “arguably
the most important innovation in the policy evaluation literature in the last 15 years” (Athey and
Imbens, 2017). The Minneapolis Federal Reserve Bank uses the method to assess the effects of the
Minneapolis 2040 Plan, which relaxed regulations to allow up to three dwellings per parcel.
26
See
Abadie (2021) for a comprehensive description of the method.
Greenaway-McGrevy (2023) applies the synthetic control method to the Auckland zoning reform,
finding that it roughly doubled the permitting rate within 5 years of the reform becoming operative
and generated an approximate 80-percent increase in permits issued over the following 6 years.
Another commonly used quasi-experimental policy evaluation method is difference-in-differences.
In this approach, changes in outcomes in treated units after a policy intervention are compared
with changes in outcomes in units that did not receive the treatment. Untreated units are a
“control” that serves as the policy counterfactual for the treated group. Freemark (2019) uses this
method to evaluate transit-oriented upzoning in Chicago, comparing housing outcomes between
upzoned and non-upzoned areas of the city.
Greenaway-McGrevy and Phillips (2023) use difference-in-differences to examine the effects of the
Auckland upzoning, comparing permits issued in upzoned residential areas of the city to permits
in non-upzoned residential areas. However, one potential problem of applying the difference-
in-differences approach is that housing construction in upzoned areas may have displaced
construction that would have otherwise occurred in non-upzoned areas of the city under the policy
counterfactual. Permits in non-upzoned areas of the city would be biased downward as a policy
counterfactual, which then generates an upward bias in any estimated policy effects.
25
The Minneapolis Federal Reserve Bank tracks the impacts of the Minneapolis 2040 plan. See https://minneapolisfed.
shinyapps.io/Minneapolis-Indicators/.
26
See https://minneapolisfed.shinyapps.io/Minneapolis-Indicators/ and https://www.minneapolisfed.org/~/media/assets/
articles/2021/new-fed-tool-will-measure-zoning-reforms-impacts-on-housing-affordability-in-minneapolis/minneapolis-
housing-indicators-technical-appendix.pdf.

Causes and Consequences of Zoning Reform in Auckland
427
Cityscape
The authors address this problem by using pre-policy intervention trends in permits in non-
upzoned areas to specify a set of counterfactual scenarios. Their approach repurposes the method
proposed by Rambachan and Roth (2023) to address another problem commonly encountered
in applications of difference-in-differences.
27
Under this approach, exact estimates of policy
effects cannot be obtained because observed outcomes in treated areas are compared to a set of
counterfactual outcomes. Nonetheless, the statistical significance of policy impacts can still be
tested conditional on the set of counterfactual outcomes.
Greenaway-McGrevy and Phillips (2023) find that, had Auckland not upzoned, the trend rate of
housing construction in non-upzoned areas of the city would have had to increase four-fold for
policy impacts to be statistically insignificant. They argue that no feasible concurrent policy change
could have generated such a significant increase in housing construction.
28
Changes in the Housing Stock
Although housing starts are indicative of how the housing stock is changing over time, they do not
directly translate into increases in the housing stock, for two reasons.
First, not every permit results in a completed dwelling. Although accurate data for Auckland over
the complete pre- and post-reform periods are lacking, the available data suggest that between 90
and 95 percent of permits result in a completion, depending on how a completion is defined.
29
Second, many housing developments tear down and replace existing dwellings. Unfortunately,
direct estimates of the gross reduction in the housing stock from teardowns are not available.
30
Motivated by this issue, Jones, Greenaway-McGrevy, and Crow (2024) estimate the net change in
Auckland’s housing stock based on district valuation rolls. These administrative records are kept
by local governments throughout New Zealand for the purpose of levying property taxes. Through
to February 2024, their estimates show that the housing stock had increased by approximately
80,000 dwellings, or 15 percent, since the AUP became operative.
31
27
Namely, violation of the parallel trends assumption.
28
Greenaway-McGrevy and Phillips (2023) also produce estimates of policy effects by restricting the counterfactual sets to a
linear trend, resulting in an estimate of 21,808 additional permits between 2017 and 2021. However, they warn that such a
restriction is subject to strict specification assumptions.
29
“Code of compliance certification” (CCC) is commonly used as a measure of completion, although dwellings can be
inhabited without a CCC. Greenaway-McGrevy and Jones (2023) explain that matching CCCs to building permits in
Auckland only became feasible from July 2017 onward because this is when a unique identifier was applied to permits
and subsequent building inspections in the administrative records. Over 91 percent of permits have a CCC issued within
4 years, while over 93 percent have a final inspection. In addition, more than 95 percent of permits have a first inspection
within 2 years, indicating that construction has commenced. Permits expire after 1 year, but developers can apply for a
1-year extension.
30
Demolitions for dwellings of fewer than three stories do not require a permit in Auckland.
31
Many of these net additions were likely to have been permitted before the AUP became operative but after it began to have
an effect through the partial upzoning under the Auckland Housing Accord program. It is difficult to ascertain how many
gross additions were originally consented under the new regulations due to the lack of a unique identifier matching permits
to dwellings in the district valuation roll.

Greenaway-McGrevy
428
Foreign Exchange
Government-Developed Housing
Like many countries, New Zealand has long had government-run or -controlled organizations that
construct housing. The nation’s primary government developer, Ka
-
inga Ora, builds houses for a
variety of purposes, including tenanted housing for low-income households, affordable housing,
and market-priced housing.
Upzoning helps government developers build more housing because it allows them to fit more
housing onto the land they own or must otherwise acquire. Public developers in New Zealand have
consequently been highly supportive of zoning reform. Ka
-
inga Ora has made multiple submissions
to local governments in New Zealand in support of widespread upzoning (Greenaway-McGrevy,
2024). Housing New Zealand (a predecessor to Ka
-
inga Ora) credits the AUP with enabling it
to meet housing demand in Auckland, stating that the additional capacity of its land holdings
increased from 3,000 homes to close to 30,000.
32
The data support this reasoning. The AUP precipitated significant increases in government-
developed housing in Auckland. Exhibit 7 shows the number of permits issued to government-
controlled institutions per 1,000 residents, illustrating that there has been a substantial increase
in Auckland since 2013, when government developers took up the development opportunities
enabled under the Auckland Housing Accord. Moreover, government housing development in
Auckland far exceeds that in other metropolitan cities in New Zealand. These patterns suggest that
zoning reform can enable governments to supply more housing, including affordable housing and
subsidized public rentals.
32
See page 30 of its “Briefing for Incoming Minister Responsible for Housing New Zealand”: https://kaingaora.govt.nz/
assets/Publications/Briefing-to-the-Incoming-Minister/briefing-for-the-incoming-minister-2016.pdf.

Causes and Consequences of Zoning Reform in Auckland
429
Cityscape
Exhibit 7
State-Developed Housing in Auckland Versus Other Cities in New Zealand, 1991–2022
1995 2000 2005 2010 2015 2020
Year
0
0.2
0.4
0.6
0.8
1
1.2
Permits Per Thousand Residents
Reform
Partial Reform
Auckland
Hamilton
Tauranga
Wellington
Dunedin
Notes: “Partial Reform” refers to the Auckland Housing Accord, which was enacted in October 2013 and allowed developers to build under the relaxed
regulations of the Proposed Auckland Unitary Plan in exchange for a 10-percent affordable housing provision. “Reform” refers to when the Auckland Unitary Plan
was made operative in November 2016.
Source: Greenaway-McGrevy, 2024
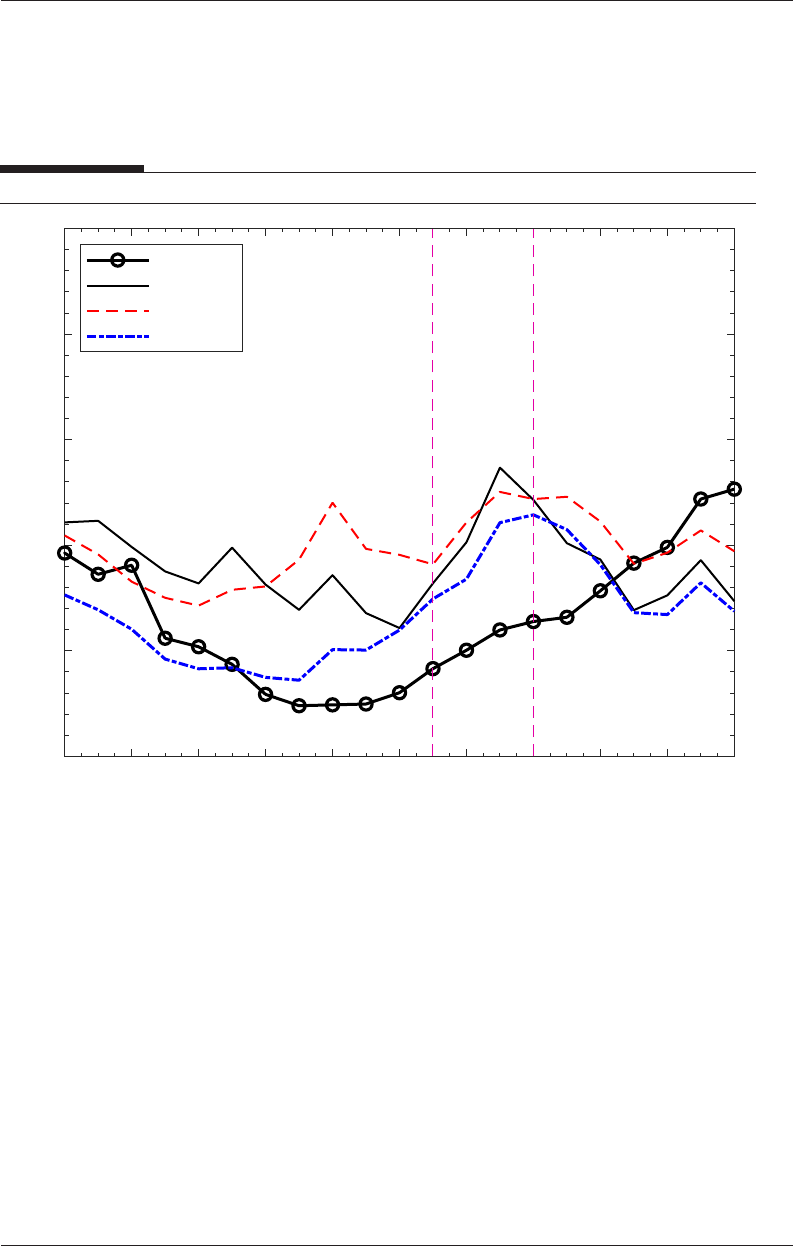
Rents
Proponents of upzoning suggest that it will not only redress housing shortages but will relieve
pressure on housing costs. Exhibit 8 presents rental price indexes constructed from new tenancies
in Auckland and comparable cities, showing that nominal rents in Auckland have increased at a
substantially slower rate than almost every other urban area in the country.
33
33
Inflation-adjusted rents in Auckland actually decreased between 2016 and 2022. The Consumer Price Index increased
by 21 percent between Q4 2016 and Q4 2022. Source: https://www.rbnz.govt.nz/monetary-policy/about-monetary-policy/
inflation-calculator.

Greenaway-McGrevy
430
Foreign Exchange
Exhibit 8
Rental Price Indexes in Auckland and Other Urban Areas of New Zealand, 2000–2022
Rent Price Index (2016 = 1)
Reform
Auckland
Hamilton
Tauranga
Wellington
1.6
1.4
1.2
1
0.8
0.6
0.4
2.4
2.2
2
1.8
1.6
1.4
1.2
1
0.8
0.6
0.4
2000
2002 2004 2006 2008 2010 2012 2014 2016 2018 2020 2022
Year
2000
2002 2004 2006 2008 2010 2012 2014 2016 2018 2020 2022
Year
Rent Price Index (2016 = 1)
Reform
Auckland
Population-Weighted Average of Other Urban Areas
Other Urban Areas
Note: “Reform” refers to when the Auckland Unitary Plan was made operative in 2016.
Source: Greenaway-McGrevy and So, 2024
Rents provide a clearer picture of housing affordability than house prices because of the
heterogeneous impacts of upzoning on the latter. Housing is a bundle of land and structure.
Because upzoning can increase the price of upzoned land, its immediate impact can be to increase
the value of land-intensive properties, such as small or dilapidated detached houses on large
parcels.
34
Consistent with this outcome, Greenaway-McGrevy, Pacheco, and Sorensen (2021)
showed that Auckland’s upzoning increased the price of land-intensive properties relative to
capital-intensive properties.
Greenaway-McGrevy and So (2024) apply the synthetic control method to rental price indexes,
finding that rents would have been 28 percent higher 6 years after the reform if Auckland had not
upzoned. Nonetheless, housing costs in the city remain highly unaffordable when measured by
either the proportion of disposable income spent on housing or house prices relative to incomes.
Auckland’s zoning reform is therefore unlikely to be a panacea, and additional policy tools and
further reforms may be required to bring the cost of housing to affordable levels.
Concluding Remarks
Widespread upzoning is increasingly advocated to redress housing shortages and alleviate rising
housing costs in many cities around the world. Until recently, proponents have had few empirical
case studies to complement the theoretical arguments underpinning this policy intervention
because few cities had pursued widespread zoning reform.
Auckland demonstrates that these arguments are no longer theoretical. Subsequent to its 2016
reform, housing construction has boomed, while rental price increases have significantly decelerated.
34
Note that this does not imply that upzoning erodes housing affordability. Upzoning encourages affordability by directly
reducing the quantity of land required per dwelling—not the price of land. Land costs of development decrease if the
reduction in quantity is proportionately greater than any increase in land price. Increases in land prices are smaller when
upzoning is widespread because development opportunities are more abundant (Phillips, 2022).

Causes and Consequences of Zoning Reform in Auckland
431
Cityscape
Auckland is no longer unique in this regard, either globally or within New Zealand. Lower Hutt,
a municipality within the Wellington metropolitan area in New Zealand, implemented a sequence
of reforms in the late 2010s that have had a substantial impact on housing starts (Maltman and
Greenaway-McGrevy, 2024). In North America, the cities of Arlington, Minneapolis, and Victoria
have enacted widespread zoning changes, and the province of British Columbia and the states of
California and Oregon have implemented regulatory changes to encourage intensification.
In many cases, it is too early to tell whether the policies have had a substantive impact. In others,
construction booms do not seem to have followed reforms (Garcia and Alameldin, 2023). The
results from New Zealand hold promise that zoning reform can help redress housing shortages
and ease pressure on housing costs. Collectively, these case studies form an important evidence
base that can inform the design of upzoning policies elsewhere to enhance housing supply.
Understanding why zoning reform has such a significant impact under some circumstances but not
others remains an important topic for future research.
Appendix
Exhibit A-1
Summary of Land Use Regulations by Residential Zone Under the Auckland Unitary Plan
Regulation
Terraced
Housing and
Apartments
Mixed Housing
Urban
Mixed Housing
Suburban
Single House
Maximum Height
16m
(5–7 stories)
11–12m
(3 stories)
8–9m
(2 stories)
8–9m
(2 stories)
Height in Relation to Boundary
3m + 45%
recession plane
3m + 45%
recession plane
2.5m + 45%
recession plane
2.5m + 45%
recession plane
Setback (side and rear) 0m 1m 1m 1m
Maximum Site Coverage 50% 45% 40% 35%
Maximum Impervious Area 70% 60% 60% 60%
Minimum Dwelling Size 45m
2
45m
2
45m
2
NA
Maximum Dwellings per Site NA 3 3 1
Minimum Lot Size (subdivision) 1,200m
2
300m
2
400m
2
600m
2
NA = not applicable
Notes: Restrictions are “as of right.” Number of stories (in parentheses) are obtained from the purpose of the height restriction as stated in the zoning
regulations. Height in relation to boundary restrictions applies to side and rear boundaries. Less restrictive height in relation to boundary rules than those
tabulated applies to side and rear boundaries within 20m of site frontage. Impervious surfaces include roofs, paved areas, and compacted metal roads.
Maximum dwellings per site are permitted as of right. Minimum lot sizes do not apply to extant residential parcels. Tabulated restrictions are not exhaustive.
Source: Greenaway-McGrevy and Jones, 2023
Acknowledgments
I thank the editor for feedback on a previous draft.
Author
Ryan Greenaway-McGrevy is an associate professor at The University of Auckland.

Greenaway-McGrevy
432
Foreign Exchange
References
Abadie, Alberto. 2021. “Using Synthetic Controls: Feasibility, Data Requirements, and
Methodological Aspects,” Journal of Economic Literature 59 (2): 391–425.
Asquith, Andy, Jeffrey McNeill, and Elizabeth Stockley. 2020. “Amalgamation and Auckland City: A
New Zealand Success Story?” Australian Journal of Public Administration 80 (4): 977–986.
Athey, Susan, and Guido W. Imbens. 2017. “The State of Applied Econometrics: Causality and
Policy Evaluation,” Journal of Economic Perspectives 31 (2): 3–32.
Been, V., I.G. Ellen, and K. O’Regan. 2019. “Supply Skepticism: Housing Supply and Affordability,”
Housing Policy Debate 29 (1): 25–40. https://doi.org/10.1080/10511482.2018.1476899.
Blakeley, Roger. 2015. “The Planning Framework for Auckland ‘Super City’: An Insider’s View,”
Policy Quarterly 11 (4): 3–14. http://dx.doi.org/10.26686/pq.v11i4.4572.
Dong, Hongwei. 2021. “Exploring the Impacts of Zoning and Upzoning on Housing Development:
A Quasi-Experimental Analysis at the Parcel Level,” Journal of Planning Education and Research
44 (1): 403–415. http://dx.doi.org/10.1177/0739456X21990728.
Ehrlich, Maximillian V., Christian A. Hilber, and Oliver Schöni. 2018. “Institutional
Settings and Urban Sprawl: Evidence from Europe,” Journal of Housing Economics 42: 4–18.
https://doi.org/10.1016/j.jhe.2017.12.002.
Fernandez, M.A., G.E. Sánchez, and S. Bucaram. 2021. “Price Effects of the Special Housing Areas
in Auckland,” New Zealand Economic Papers 55 (1): 141–154. https://doi.org/10.1080/00779954.20
19.1588916.
Fischel, William A. 2001. The Homevoter Hypothesis: How Home Values Influence Local Government
Taxation, School Finance, and Land-Use Policies. Cambridge, MA: Harvard University Press.
https://www.hup.harvard.edu/books/9780674015951.
———. 2008. “Political Structure and Exclusionary Zoning: Are Small Suburbs the Big Problem?”
In Fiscal Decentralization and Land Policies, edited by Gregory K. Ingram and Yu-Hung Hong.
Cambridge, MA: Lincoln Institute of Land Policy: 111–136.
Foster, David, and Joseph Warren. 2022. “The NIMBY Problem,” Journal of Theoretical Politics
34 (1): 145–172. http://dx.doi.org/10.1177/09516298211044852.
Freeman, Lance, and Jenny Schuetz. 2017. “Producing Affordable Housing in Rising Markets:
What Works?” Cityscape 19 (1): 217–236.
Freemark, Yonah. 2019. “Upzoning Chicago: Impacts of a Zoning Reform on Property Values and
Housing Construction,” Urban Affairs Review 56 (3): 758–789.

Causes and Consequences of Zoning Reform in Auckland
433
Cityscape
Garcia, David, and Muhammad Alameldin. 2023. “California’s HOME Act Turns One: Data and
Insights From the First Year of Senate Bill 9.” https://ternercenter.berkeley.edu/research-and-policy/
sb-9-turns-one-applications/.
Glaeser, Edward L., and Joseph Gyourko. 2003. “The Impact of Building Restrictions on Housing
Affordability,” Economic Policy Review June: 21–39.
Gray, M. Nolan. 2022. Arbitrary Lines: How Zoning Broke the American City and How to Fix It.
Washington, DC: Island Press.
Greenaway-McGrevy, Ryan. 2024. Zoning Reform and State-Developed Housing in Auckland.
Working paper 019. Auckland, NZ: University of Auckland, Economic Policy Centre. https://www.
auckland.ac.nz/assets/business/our-research/docs/economic-policy-centre/EPC-WP-019-zoning-
reform-and-state-developed-housing-in-auckland.pdf.
———. 2023. Can Zoning Reform Increase Housing Construction? Evidence from Auckland. Working
paper 017. Auckland, NZ: University of Auckland, Economic Policy Centre. https://www.auckland.
ac.nz/assets/business/our-research/docs/economic-policy-centre/Working%20paper%2017.pdf.
Greenaway-McGrevy, Ryan, and James Allen Jones. 2023. Can Zoning Reform Change Urban
Development Patterns? Evidence from Auckland. Working paper 012. Auckland, NZ: University of
Auckland, Economic Policy Centre. https://www.auckland.ac.nz/assets/business/012WP.pdf.
Greenaway-McGrevy, Ryan, and Peter C.B. Phillips. 2023. “The Impact of Upzoning on Housing
Construction in Auckland,” Journal of Urban Economics 136: 103555. https://doi.org/10.1016/j.
jue.2023.103555.
Greenaway-McGrevy, Ryan, and Yun So. 2024. Can Zoning Reform Reduce Housing Costs?
Evidence From Rents in Auckland. Working paper 016. Auckland, NZ: University of Auckland,
Economic Policy Centre. https://www.auckland.ac.nz/assets/business/our-research/docs/economic-
policy-centre/EPC-WP-016.pdf.
Greenaway-McGrevy, Ryan, Gail Pacheco, and Kade Sorensen. 2021. “The Effect of Upzoning on House
Prices and Redevelopment Premiums in Auckland, New Zealand,” Urban Studies 58 (5): 959–976.
Jones, James Allen, Ryan Greenaway-McGrevy, and Chris Crow. 2024. Using Council Valuation
Records to Estimate Auckland’s Housing Stock. Urban and Spatial Economics Hub Policy Paper No.
002. Auckland, NZ: University of Auckland, Economic Policy Centre. https://www.auckland.ac.nz/
assets/business/our-research/docs/economic-policy-centre/urban-and-spatial-economics/Using%20
Council%20Valuation%20Records%20to%20Estimate%20Auckland%27s%20Housing%20Stock.pdf.
Maltman, Matthew, and Ryan Greenaway-McGrevy. 2024. Going It Alone: The Impact of Upzoning
on Housing Construction in Lower Hutt. Working paper 018. Auckland, NZ: University of
Auckland, Economic Policy Centre. https://www.auckland.ac.nz/assets/business/our-research/
docs/economic-policy-centre/EPC-WP-018-going-it-alone-the-impact-of-upzoning-on-housing-
construction-in-lower-hutt.pdf.

Greenaway-McGrevy
434
Foreign Exchange
Manville, M., P. Monkkonen, and M. Lens. 2020. “It’s Time to End Single-Family Zoning,” Journal of
the American Planning Association 86 (1): 106–112.
Martin, Anya. 2023. “Houston, We Have a Solution,” Works in Progress 12, September 7.
https://worksinprogress.co/issue/houston-we-have-a-solution/.
New Zealand Productivity Commission. 2015. Using Land for Housing. Wellington,
NZ: New Zealand Productivity Commission. https://www.productivity.govt.nz/assets/
Documents/6a110935ad/using-land-for-housing-final-report.pdf.
Phillips, Shane. 2022. Building Up the “Zoning Buffer”: Using Broad Upzones to Increase Housing
Capacity Without Increasing Land Values. UCLA Reports. https://escholarship.org/uc/item/0r53h7pw.
Rambachan, Ashesh, and Jonathan Roth. 2023. “A More Credible Approach to Parallel Trends,” The
Review of Economic Studies 90 (5): 2555–2591.
Schill, Michael H. 2005. “Regulations and Housing Development: What We Know.” In The
Affordable Housing Reader, edited by J. Rosie Tighe and Elizabeth J. Mueller. London: Routledge.
Tricaud, C. 2021. Better Alone? Evidence on the Costs of Intermunicipal Cooperation. CEPR
Discussion Paper No. DP15999.
