
UK business opportunities of moving to a low
carbon economy
FINAL REPORT
______________________________________________________________
Ricardo Energy & Environment for the Committee on Climate Change.
Tender Reference Number TH [2]/10/16
ED 10039 | Issue Number V7 | Date 15/03/2017
Ricardo in Confidence

UK business opportunities of moving to a low carbon economy I i
Ricardo in Confidence
Ref: Ricardo/ED10039 V7
Ricardo Energy & Environment
Customer:
Contact:
The Committee on Climate Change (CCC)
James Tweed, Ricardo Energy & Environment,
Gemini Building, Fermi Avenue, Harwell, Oxon,
OX11 0QR, United Kingdom.
t: +44 (0) 1235 753007
e: jam[email protected]
Ricardo-AEA Ltd is certificated to ISO9001 and
ISO14001
Customer reference:
TH [2]/10/16
Confidentiality, copyright & reproduction:
This report is the Copyright of Ricardo Energy &
EnvironmentRicardo Energy & Environment. It
has been prepared by Ricardo Energy &
Environment, a trading name of Ricardo-AEA Ltd,
under contract to the Committee on Climate
Change dated 01/12/2016. The contents of this
report may not be reproduced in whole or in part,
nor passed to any organisation or person without
the specific prior written permission of the
Commercial manager at Ricardo Energy &
Environment. Ricardo Energy & Environment
accepts no liability whatsoever to any third party
for any loss or damage arising from any
interpretation or use of the information contained
in this report, or reliance on any views expressed
therein.
Authors:
Heather Haydock, Alan McCullough, Chris
Nuttall, Louise Evans, Anna-Liisa Kaar, Eugenia
Bonifazi, Raphael Sibille, Martin Houghton
(TBR/OrtusER) and Sam Nair (TBR/OrtusER),
Approved By:
James Tweed
Date:
15 March 2017
Ricardo Energy & Environment reference:
Ref: ED10039 Draft Final Report- V7

UK business opportunities of moving to a low carbon economy I ii
Ricardo Energy & Environment
Ricardo in Confidence
Ref: Ricardo/ED10039 V7
Table of contents
1 Introduction ................................................................................................................ 1
2 The timelines for the global LCE transition ............................................................. 1
2.1 Introduction ........................................................................................................................ 2
2.2 Overview of key sources ................................................................................................... 2
2.2.1 IEA Energy Technology Perspectives 2016 ............................................................. 2
2.2.2 CCC Fifth Carbon Budget Scenarios ....................................................................... 4
2.3 Phase 1: 2017 to 2030 – A more energy efficient world ................................................... 6
2.3.1 Power Generation .................................................................................................... 6
2.3.2 Transport .................................................................................................................. 6
2.3.3 Industry ..................................................................................................................... 7
2.3.4 Buildings ................................................................................................................... 8
2.3.5 Other Sectors ........................................................................................................... 8
2.4 Phase 2: 2031 to 2050 – A more resource efficient world ................................................ 8
2.4.1 Power Generation .................................................................................................... 8
2.4.2 Transport .................................................................................................................. 9
2.4.3 Industry ................................................................................................................... 10
2.4.4 Buildings ................................................................................................................. 10
2.4.5 Greenhouse gas removal technologies .................................................................. 11
2.5 Phase 3: 2051 to 2100 – A sustainable, low carbon world ............................................. 11
2.6 Timeline Analysis Conclusions ........................................................................................ 12
3 Current UK Competitive Position............................................................................ 14
3.1 Low carbon technology RD&D ........................................................................................ 14
3.2 UK strengths in low carbon innovation ............................................................................ 15
3.3 UK Export Performance .................................................................................................. 16
3.4 Current UK low carbon goods and services market ........................................................ 17
4 Global opportunities for UK Manufacturing ........................................................... 21
4.1 Approach to the quantification of market opportunity ...................................................... 21
4.2 Future global low carbon economy markets ................................................................... 21
4.2.1 Low Carbon Electricity ............................................................................................ 23
4.2.2 Low Emission Vehicles ........................................................................................... 24
4.2.3 Low Carbon Financial Services .............................................................................. 25
4.2.4 Other Low Carbon Products and Services ............................................................. 26
4.3 Size of the LCE opportunity for UK business .................................................................. 27
4.3.1 Low Carbon Electricity ............................................................................................ 29
4.3.2 Low Emissions Vehicles ......................................................................................... 30
4.3.3 Low carbon financial services ................................................................................ 31
4.3.4 Oher Low Carbon Products and Services .............................................................. 32
4.4 Projection of overall future market opportunities ............................................................. 33
4.5 Opportunities for UK firms to capture a greater share of future global markets ............. 34
5 Stakeholder views on opportunities, barriers and potential actions ................... 35
5.1 Introduction ...................................................................................................................... 35
5.2 Low carbon electricity ...................................................................................................... 35
5.2.1 Opportunities .......................................................................................................... 35
5.2.2 Barriers ................................................................................................................... 35
5.2.3 Actions that could be taken to increase share of global market ............................ 35
5.2.4 Other issues around capturing new market opportunities ...................................... 36
5.3 Low emission vehicles ..................................................................................................... 37
5.3.1 Opportunities .......................................................................................................... 37
5.3.2 Barriers ................................................................................................................... 37
5.3.3 Actions that could be taken to increase share of global market ............................ 38
5.4 Energy efficient products ................................................................................................. 38
5.4.1 Opportunities .......................................................................................................... 38
5.4.2 Barriers ................................................................................................................... 38
5.4.3 Actions that could be taken to increase share of global market ............................ 38
5.4.4 Other issues around capturing new market opportunities ...................................... 38

UK business opportunities of moving to a low carbon economy I iii
Ricardo Energy & Environment
Ricardo in Confidence
Ref: Ricardo/ED10039 V7
5.5 Other sectors ................................................................................................................... 39
5.5.1 Opportunities .......................................................................................................... 39
5.5.2 Barriers ................................................................................................................... 39
5.5.3 Actions that could be taken to increase share of global market ............................ 39
5.5.4 Other issues around capturing new market opportunities ...................................... 40
6 Conclusions on opportunities to increase the UK share of future global
markets .............................................................................................................................. 40
Acknowledgements .......................................................................................................... 41
Appendices
Appendix 1: Methodology for estimating current market value for UK manufacturers of low carbon goods
and services
Appendix 2: Comparison of sectors and technologies considered
Appendix 3: Data sources and assumptions for estimating the size of future global markets associated
with the low carbon economy
Appendix 4: Summary data from current analysis

UK business opportunities of moving to a low carbon economy I iv
Ricardo Energy & Environment
Ricardo in Confidence
Ref: Ricardo/ED10039 V7
Executive summary
The Paris Agreement on climate change action aims to limit global warming to well below 2°C and to
pursue efforts to limit it to 1.5°C. This agreement came into force in November 2016 and requires major
reductions in greenhouse gas emissions (GHG) by 2050 and net zero global emissions in the second
half of this century. This transition will require goods such as renewable energy and energy efficient
technologies, and services such as green bonds and the recycling of batteries for electric vehicles.
This transition to a low carbon economy (LCE) presents opportunities for UK businesses to supply the
goods and services required by the UK and other countries. Businesses and government can enhance
the exploitation of these global market opportunities through identification of, and investment in, the
range of areas where UK businesses have particular strengths and leading technologies.
The aim of this report is to extend the analysis of opportunities for UK business to supply global markets
for low carbon materials, goods and services that are anticipated to be required for transition to a low
carbin economy. The report consists of six sections:
Section 1 provides a brief introduction to the project
Section 2 describes the timelines for the global transition to a low carbon economy,
Section 3 considers the position of the current UK low carbon economy,
Section 4 quantifies the size of the market opportunity for UK business in 2030 and 2050
Section 5 describes the barriers to UK business capturing a larger share of the global market.
Section 6 presents conclusions.on opportunities to increase UK share of future global markets.
The work was funded by the Committee on Climate Change (CCC) and delivered by Ricardo Energy &
Environment supported by Trends Business Research and Ortus Economic Research Ltd.
To identify sectors where the UK might have “first mover advantage”, we compared the projected
timelines for the global and UK low carbon transition, as outlined in the International Energy Agency’s
(IEA) scenarios for global emissions reductions, and CCC’s scenarios and best estimates of the most
cost effective path for reaching the UK’s 2050 target of an 80% reduction in GHG emissions compared
to 1990.
A key finding of this analysis is that the UK and the EU were likely to make the transition to the low
carbon economy around 10 years ahead of the world average. We also identified three sectors
(electricity, transport and waste) where the UK is making major progress and investment in emission
reduction and these clearly offer business opportunities in the UK home market, and global export
markets. However there are also opportunities for UK business to supply goods and services in other
sectors, and a range of new technologies will be needed to complete the global transition, particularly
beyond 2050.
We also concluded that the technologies need to complete the global transition are broadly similar to
those required by the UK market, although there were some geographical variations, for example: the
UK is likely to deploy higher levels of off-shore wind and lower levels of solar PV than the global average.
The overall approach to the transition in other regions is also similar to that in the UK, and involves:
Implementing energy efficiency measures, particularly in the period up to 2030.
Deploying proven low carbon technologies. Costs for some of these will be expected to
decrease with deployment, as has been the case recently with solar photovoltaic cells.
Demonstration projects for other technologies that are close to deployment and/or require cost
reduction, in preparation for wide scale deployment, particularly between 2030 and 2050.
Investing in further research and innovation in hard-to-reduce sectors, such as aviation.
Undertaking basic research and development on novel greenhouse gas removal technologies
which are likely to be required to reach zero net emissions in the second half of the century

UK business opportunities of moving to a low carbon economy I v
Ricardo Energy & Environment
Ricardo in Confidence
Ref: Ricardo/ED10039 V7
Current UK Competitive Position
Over the last 15 years, the UK has made a substantial investment in energy and low carbon technology
research, development and demonstration (RD&D). For example, the Research Councils UK (RCUK)
Energy Programme invested £839 million between 2003 and 2011, and a further £625 million is being
invested between 2012 and 2018. Innovate UK has also funded a wide range of industrial RD&D
projects, and knowledge transfer networks (KTN) in many sectors of the economy
1
that support
business seeking to develop new materials, goods and services for the low carbon economy. These
investments, and others related to the wider impact of climate change on business and society mean
that the UK is well placed to obtain a share of the growing market associated with transition to a LCE,
provided concerted action is taken by suppliers and government to ramp up export activities.
With the aid of our experts and stakeholder feedback, we have assessed whether there is a low, medium
or high potential for UK business to capture market share in each of the main segments of the UK LCE
market and identified some examples where the UK currently has particular strength, including:
Electric Vehicles
Smart Grids
Transport telematics
Energy storage
Off-shore wind
Biofuels
Solar PV
We have also identified some technologies that will need to be fully deployed by 2050, where the UK
could exploit its existing capabilities in other fields to capture a share of the global market. These
include:
Advanced materials and manufacturing, including design for reuse and waste recovery.
Low carbon chemical processes using bioprocessing, catalysts and membrane technology
In addition, there are significant opportunities for the UK services sector to establish itself as a financial
hub for green finance and gain a sizable share of the financial services associated with the estimated
capital investment of between $1.5 and $6 trillion per annum needed to deliver the global transition.
Current Size of the UK LCE Market.
We used two methods to assess the size of the UK market for low carbon goods and services in 2015,
which we estimated employed between 230 and 450 thousand people, and had a turnover of between
£42 billion and £120 billion. The first method used the provisional results of ONS’s Low Carbon and
Renewable Energy Economy Survey published in late 2016. This assessed direct employment and
turnover for the LCE sector only. The second method updated the estimates published by BIS of the
size of the LCE market in 2013. This assessed both direct and indirect employment and turnover.
Size of the LCE Market Opportunities for UK Business
Our analysis suggests that the UK low carbon economy could grow from around 2% of UK Total Output
in 2015 to up to around 8% by 2030, and around 13% by 2050. The projected compound annual growth
rate for the low carbon economy is 11% per annum between 2015 to 2030, and 4% per annum between
2030 and 2050, which is substantially higher than the OECD’s projection of average UK GDP growth
of 2.3% per annum between 2015 and 2050
2
This corresponds to a UK LCE market size of between
£210 billion and £600 billion in 2030 and between £510 billion and £1,400 billion in 2050. The levels of
UK employment associated with the LCE are between 1.0 and 2.2 million in 2030, and between 2.5 and
5.0 million in 2050.
These projections are based on an assessment of the potential size of 25 selected areas of the UK and
global LCE market in 2030 and 2050, and draw on the scenarios for technology deployment outlined in
the IEA’s Energy Technology Perspectives 2016 and technology roadmaps, the CCC’s own scenarios
and a number of estimates by market research organisations of current market size and growth rates.
These projections also include an estimate of the UK share of the global market, which is based on the
UK’s current share of global exports, and hence on the UK’s current strengths in manufacturing and
services. There is the potential to increase this share by building on UK strengths in research and
innovation and by addressing barriers to market entry and growth outlined in Section 5 of this report.
1
https://admin.ktn-uk.co.uk/app/uploads/2016/09/KTN-Annual-Report-2015_2016.pdf
2
https://data.oecd.org/gdp/gdp-long-term-forecast.htm

UK business opportunities of moving to a low carbon economy I 1
Ricardo Energy & Environment
Ricardo in Confidence
Ref: Ricardo/ED10039 V7
1 Introduction
The Paris Agreement on climate change action entered into force in November 2016, having been
ratified by the USA, China, India, Brazil, the EU and other countries. The Agreement aims to limit global
warming to well below 2°C and to pursue efforts to limit it to 1.5°C. This will require major reductions in
greenhouse gas emissions by 2050 and net zero global emissions in the second half of this century,
which in turn will drive a transition to a low carbon economy (LCE) in both developed and developing
countries. The LCE includes goods such as renewable energy and energy efficient technologies, and
services such as green bonds and the recycling of batteries for electric vehicles.
This transition to a low carbon economy presents opportunities for the UK in provision of the goods and
services required. This can be both in supplying the UK market as it makes the transition and also in
supplying global markets. Businesses and government can enhance the exploitation of these
opportunities through identification of and investment in the range of areas where the UK has particular
business strengths and leading technologies.
The CCC published a review of the UK’s research and innovation arrangements for delivering
technologies required to meet the UK’s climate change targets in 2010
3
. This report also identified
opportunities for the UK to develop new technologies and take a lead in global markets, including in
offshore wind, marine, Carbon Capture & Storage (CCS), smart grids, aviation and electric vehicle
technologies. In 2013, the CCC also reported on opportunities to create new global markets for products
from the energy-intensive sectors
4
.
The aim of this report is to update and extend the analysis of opportunities for UK business to supply
global markets for low carbon materials, goods and services that the LCE transition will create by:
Exploring the timelines around the global transition to a low carbon economy.
Quantifying the size of the global market for low carbon materials, goods and services
Identifying potential export opportunities for UK’s manufacturing and service sectors
Assessing the potential UK share of the global market in example application areas.
This will feed into an updated assessment of the opportunities that transitioning to a LCE could provide
for the UK’s manufacturing sectors, to be undertaken by CCC in early 2017.
This report comprises five sections in addition to this introduction. Section 2 describes the timelines for
the global transition to a low carbon economy, Section 3 considers the position of the current UK low
carbon economy, Section 4 quantifies the size of the market opportunity for UK business in 2030 and
2050, and Section 5 describes the opportunities and barriers to UK business capturing a larger share
of the future global market. Section 6 presents conclusions.
2 The timelines for the global LCE transition
The technologies needed to complete the global transition are boadly similar to those required by the
UK market, although there were some geographical variations, for example: the UK is likely to deploy
higher levels of off-shore wind and lower levels of solar PV than the global average.
The overall approach to the transition in other regions is also similar to that in the UK, and involves:
Implementing energy efficiency measures, particularly in the period up to 2030.
Deploying proven low carbon technologies. Costs for some of these will be expected to
decrease with deployment, as has been the case recently with solar photovoltaic cells.
Demonstration projects for other technologies that are close to deployment and/or require
cost reduction, in preparation for wide scale deployment, particularly between 2030 and
2050.
Investing in further research and innovation in hard-to-reduce sectors, such as aviation.
3
“Building a low-carbon economy – the UK’s innovation challenge ”, The Committee on Climate Change, 2010
4
“Managing competitiveness risks of low-carbon policies”, The Committee on Climate Change, 2013.

UK business opportunities of moving to a low carbon economy I 2
Ricardo Energy & Environment
Ricardo in Confidence
Ref: Ricardo/ED10039 V7
Undertaking basic research and development on novel greenhouse gas removal
technologies which are likely to be required to reach zero net emissions in the second half
of the century
2.1 Introduction
This section provides an overview of the timeline for the deployment of different technologies for the
transition towards a low carbon economy, including both global and UK perspectives.
The information provided in this section is based on a number of key sources. This includes the
scenarios developed under the IEA Energy Technology Perspectives 2016
5
and the CCC’s reports on
the Fifth Carbon Budget
6
and ‘UK climate action following the Paris agreement’
7
for information related
to global and UK emission reductions respectively.
The timeline for the transition to a low carbon economy has been split into three district phases:
Phase 1: 2017 to 2030 – this aligns with the time period for the pledges made by countries as
part of the Paris Agreement
Phase 2: 2031 to 2050 – this aligns with IEA models and UK’s commitment to a reduction in
emissions of at least 80% in 2050
Phase 3: 2051 to 2100 – to align with the global objective to hold the increase in global
temperature to below 2°C and to pursue efforts to limit it to 1.5°C
For Phases 1 and 2 information is presented for the following key emissions-reduction sectors
8
; power
generation, transport, industry and buildings. For each sector the key activities/technologies are
highlighted for the respective phases. Where information is available, other emission-reduction sectors
such as agriculture, waste and F-gases are also covered. Information for Phase 3 is less detailed and
as such an overview of the key trends that can currently be expected is provided.
2.2 Overview of key sources
2.2.1 IEA Energy Technology Perspectives 2016
The International Energy Agency (IEA) Energy Technology Perspectives 2016 sets out a series of
scenarios for different levels of ambition up to 2050 – see examples in Table 1.
Table 1: Summary of IEA Energy Technology Perspective 2DS and 6DS Scenarios 2016
9
Scenario
Description
2°C
Scenario
(2DS)
2DS lays out an energy system deployment pathway and an emissions trajectory
consistent with at least a 50% chance of limiting the average global temperature
increase to 2°C. The reductions in carbon dioxide emissions envisaged under the 2DS
scenario go considerably beyond the Nationally Determined Contributions (NDCs) set
out in the Paris Agreement
10
.
6°C
Scenario
(6DS
6DS is largely an extension of current trends and is used as the baseline against
which to determine the additional investment in energy efficiency measures and
renewable energy deployment that will be required by 2050.
5
IEA (2016) Energy Technology Perspectives 2016 - Towards Sustainable Urban Energy Systems
6
Committee on Climate Change (2015) The Fifth Carbon Budget – The next step towards a low-carbon economy
7
Committee on Climate Change (2016) UK climate action following the Paris Agreement
8
This report is about business opportunities arising from transition to a low carbon economy. Later sections will refer to sectors based on analysis
by the Office of National Statistics and in this work of the low carbon economy in the UK. Power generation, later termed low carbon electricity,
and transport, are common to the two breakdowns. Other emissions-reduction sectors do not match 1:1 with low carbon economy sectors. As an
example some areas of opportunity such as low carbon finance and adaptation are not included in the emission-reduction sectors.
9
http://www.iea.org/publications/scenariosandprojections/
10
https://www.iea.org/publications/freepublications/publication/ECCE2016.pdf

UK business opportunities of moving to a low carbon economy I 3
Ricardo Energy & Environment
Ricardo in Confidence
Ref: Ricardo/ED10039 V7
The IEA Energy Technology Perspectives provides a consistent approach at a global level at which
different scenarios can be compared against each other. Further details about the Energy Technology
Perspectives model approach and the assumptions used are detailed on the IEA website
11
.
The difference between the scenarios can be compared to identify the reduction in emissions for
different sectors. Table 2 summarises the percentage contribution to reduction in emissions between
the 6DS and 2DS for the period 2015-2050 by sector.
Table 2: Percentage contributions by sector to reductions at 2030 and 2050 in energy related CO
2
and
Green House Gas (GHG) emissions between 6DS and 2DS scenarios
12
Sector
2030
2050
Agriculture
0
0
Commercial
5
6
Residential
8
7
Transport
16
19
Industry
26
21
Other transformation
5
7
Power
39
39
The information presented in Table 2 indicates the following key global trends over the 2015-2050
period with respect to relative energy related global reductions in CO2 and Green House Gas (GHG)
emissions:
The largest relative contributor to emissions reductions in 2030 and 2050 is the power
generation sector, which was responsible for 47% of global energy related emissions in 2014
13
;
The transport and industry sectors, which were responsible for 43% of global energy related
emissions in 2014, also make major contributions to emissions reduction in 2030 and 2050;
All other sectors contribute about 20% of emissions reductions in 2030 and 2050
Sectors that will make the largest contribution to global emissions reductions in 2030 and 2050 are
power generation, transport and industry. These are prime candidates for significant business
opportunities arising from the low carbon transition.
The IEA scenarios also illustrate the relative time of the low carbon transition in different regions of the
world. Figure 1 presents relative projected changes in emissions from 2011 levels for the world and
major regions and countries.
11
http://www.iea.org/etp/etpmodel/ and http://www.iea.org/etp/etpmodel/assumptions/
12
http://www.iea.org/etp/explore/
13
http://www.iea.org/publications/freepublications/publication/CO2-emissions-from-fuel-combustion-highlights-2016.html

UK business opportunities of moving to a low carbon economy I 4
Ricardo Energy & Environment
Ricardo in Confidence
Ref: Ricardo/ED10039 V7
Figure 1: Emissions with time compared to 2011 figures for some major countries/ regions compared with
the overall projection for the world
Source: International Energy Agency, Energy Technology Perspectives 2016 - www.iea.org/etp2016
The UK (which is included in the projections for EU in Figure 1) and USA are projected to make the
transition about 10 years earlier than the world average.
For countries, including the UK, that make the low carbon transition earliest, there may be
opportunities to supply technology, products and services to countries that make the transition later.
2.2.2 CCC Fifth Carbon Budget Scenarios
To understand in which sectors the UK might have “first mover advantage”, we examined the analysis
in support of CCC’s Fifth Carbon Budget
14
15
, which provides estimates of carbon emissions and
reductions for a number of scenarios across the power, transport, industry, agriculture, waste and F-
Gas emission-reduction sectors for the period 2014-2050 (see Figure 2). We explored CCC’s Central
Scenario, which represents the CCC’s best estimate of the cost effective path for reaching the UK’s
2050 target of at least an 80% reduction in emissions of greenhouse gases compared to 1990.
14
Committee on Climate Change (2015) The Fifth Carbon Budget – The next step towards a low-carbon economy
15
Committee on Climate Change (2015) Sectoral scenarios for the Fifth Carbon Budget – Technical Report
UK business opportunities of moving to a low carbon economy I 5
Ricardo Energy & Environment
Ricardo in Confidence
Ref: Ricardo/ED10039 V7
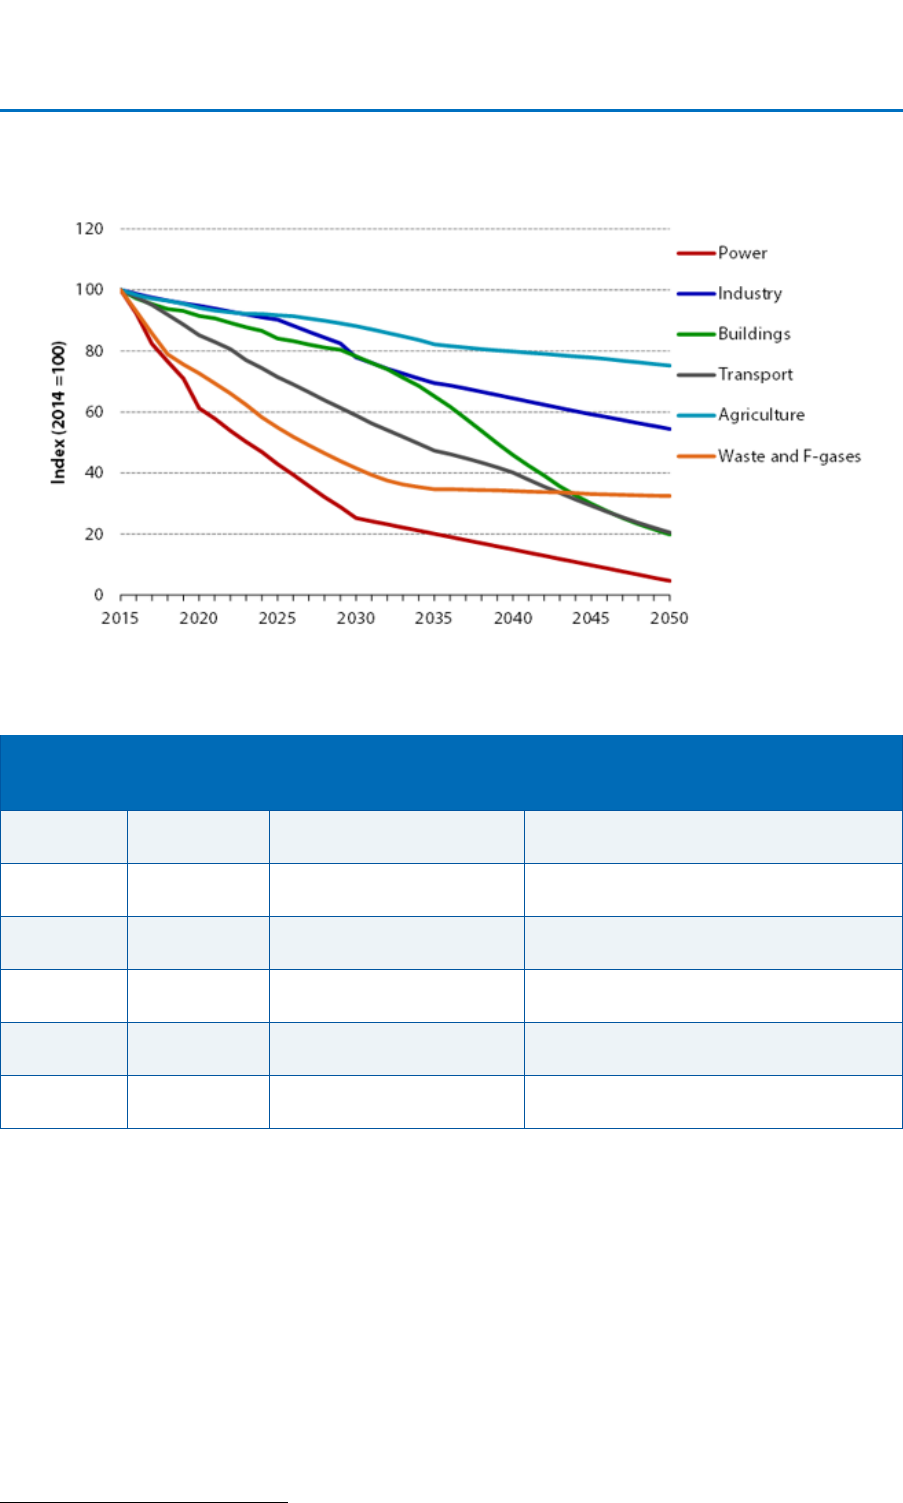
Figure 2: Central scenario emissions paths to 2050
16
Projected reductions of emissions by time and sector are summarised in Table 3.
Table 3: Summary of UK projected emissions reductions by time and sector
Sector
% UK CO
2
Emissions in
2014
2015 – 2030
2030-2050
Power
23 %
Very significant reduction
in emissions (about 75%)
Further reduction in emissions at a
slower rate (about a further 20%)
Transport
23 %
Significant reduction in
emissions (about 45%)
Further significant reduction in
emissions (about another 35%
Waste and
F-gases
7 %
Major reduction in
emissions (about 60%)
Relatively low further reduction by 2035,
then flattens off (about another 5%)
Buildings
16 %
Modest reduction in
emissions (about 25%)
Significant reduction in emissions
(about another 55%)
Industry
21 %
Modest reduction in
emissions (about 25%)
Modest reduction in emissions (about
another 20%)
Agriculture
9 %
Relatively low reduction in
emissions (about 15%)
Relatively low reduction in emissions
(about another 10%)
The progression with time reflects the relative ease of and effort in addressing emissions in the
sectors. A major early focus is the power sector with almost complete elimination of emissions
projected by 2050 through the deployment of renewable electricity, nuclear or CCS technologies.
Progress in emissions reductions from transport is projected to be relatively linear to 2050 through the
progressive deployment of battery electric, hybrid plug in electric and fuel cell electric vehicles, and by
shifting car journeys to low and no carbon alternatives e.g. public transport, cycling and walking.
In the waste sector and F-gas sector, a rapid reduction in emissions is envisaged prior to 2030 due to
reductions in emissions from landfill, and leaks from refrigeration and air conditioning equipment.
In the other sectors, a modest or low rate of reduction is anticipated between 2015 and 2050, except
in the buildings sector, where the more significant emissions reduction is anticipated from 2030 to
2050 through increased energy efficiency and the use of low carbon space heating technologies.
16
Source – Figure 1.14 from Committee on Climate Change (2015) Sectoral scenarios for the Fifth Carbon Budget – Technical Report

UK business opportunities of moving to a low carbon economy I 6
Ricardo Energy & Environment
Ricardo in Confidence
Ref: Ricardo/ED10039 V7
Sectors where UK is making major progress and investment in emissions reductions, clearly offer
opportunities in the home market and also offer opportunities for supply to global markets
2.3 Phase 1: 2017 to 2030 – A more energy efficient world
2.3.1 Power Generation
Key technologies globally include solar PV, on-shore wind, hydro and nuclear
Key technologies within the UK will include renewables including offshore wind,
nuclear, CCS and bioenergy
The initial deployment of less mature technologies will be required
To reduce the carbon intensity of power generation at a global level up to 2030 key technologies
identified by the IEA will include onshore wind, solar PV, and hydro, with increasing importance of
nuclear, as shown in Figure 3.
The position in the UK will be similar, increasing the share of low carbon generation through a range of
different mixes of technologies such as renewables including offshore wind, nuclear and plants with
carbon, capture and storage fitted. Bioenergy is also identified as having an important role, but is limited
by sustainable supply. The implementation of technologies such as offshore wind and CCS during this
period will be important for the UK to meet 2050 targets. Reduced support from UK Government for
CCS Research, Development and Demonstration (RD&D) could impact the deployment of this
technology.
Other technologies will start to be deployed, but this will increase post 2030, and are covered in phase
2 below. The deployment of less mature technologies will be important to enable these to become lower
cost options in future phases in order to meet 2050 targets.
Figure 3: Global deployment rates for low carbon power technologies in the 2DS
17
2.3.2 Transport
Energy efficiency improvements in conventional internal combustion engines and use
of biofuels
Ongoing electrification of vehicles
17
Source – Figure 1.8 from IEA (2016) Energy Technology Perspectives 2016 - Towards Sustainable Urban Energy Systems

UK business opportunities of moving to a low carbon economy I 7
Ricardo Energy & Environment
Ricardo in Confidence
Ref: Ricardo/ED10039 V7
Technologies to improve efficiency of different transport modes such as materials
substitution to reduce weight, advanced lubricants and advanced aerodynamics
To meet the IEA 2DS requires a number of changes in the transport sector across all modes of transport.
In this phase improvements in conventional internal combustion engines will continue to be important
in improving energy efficiency. This will be complemented by replacement of fossil liquid fuels with
biofuels – initially in trucking and aviation and by electrification of passenger vehicles, with 2 and 3
wheel vehicles and light freight phased in rapidly – in particular in OECD countries, China and India.
Electric vehicles could include battery electric vehicles (BEVs), Plug in Hybrid Electric Vehicles (PHEVs)
and Fuel Cell Electric Vehicles (FCEVs), which include fuel cell systems and hydrogen storage, though
the FCEV stock is expected to remain marginal in this phase.
Possible technologies for public buses include overhead energy supply, batteries and supercapacitors
together with inductive charging and contact based systems and battery swapping concepts. The use
of hydrogen buses up to 2030 is also included as part of the UK’s Fifth Carbon Budget central scenario.
Hybridisation of trucks is anticipated to start slowly in this phase and increase in the next phase. The
aviation sector, in addition to initial deployment of biofuels, will also need continued deployment of
energy efficient technologies.
At the sub-system level it is anticipated that the phase to 2030 will see deployment of technologies to
improve energy efficiency of road transport. These may include: material substitution to reduce weight,
low rolling resistance tyres, advanced lubricants, advanced aerodynamics, exhaust heat recovery,
powertrains with low energy consumption per unit load (this could include hybridisation and
electrification).
Similarly, for rail transport, deployment is anticipated of technologies to improve energy efficiency of
trains, for example material substitution to reduce weight, improved aerodynamics, designs allowing
higher capacity, powertrains with low energy consumption per unit load (mainly electric motors).
In addition to vehicle technologies, the phase to 2030 is also expected to exhibit development of
information and communication technologies for travel demand management. This includes: providing
information for car sharing and bike rental systems, car-pooling users and public transport; and
automatic identification and data capture to enable real time variable congestion charging and regulate
access to segments of the road network.
2.3.3 Industry
Deployment of energy efficiency measures within industrial sectors
Use of low carbon fuels and feedstock and increased recovery of excess energy
CCS identified as key technology within the UK
For the IEA 2DS emission requirements industrial energy consumption needs to be decoupled from the
increasing demand for materials. Under the 2DS industrial energy use will increase slightly through to
2050, but CO
2
emissions will peak in 2020. This requires a reduction in the carbon intensity of energy
used in industrial sectors.
In the short term (up to 2020) this change is primarily driven by energy efficiency (Best Available
Technology deployment), with energy efficiency measures varying between sectors and processes.
The use of low carbon fuels and feedstocks and increased recovery of excess energy will also be
important. This includes the electrification of industrial processes to meet 2DS requirements.
Similar action has been identified for the UK with emission reductions driven by technologies covering
better energy management and process control, the use of more energy efficient plant and equipment,
waste heat recovery and use of bioenergy in space and process heat. CCS is again identified as a key
technology, with CCS cluster developments enabling its use in key industry sectors, including iron and
steel and chemicals. Depending on technological developments, hydrogen could also be used as an
alternative to CCS. As noted above, the reduced support from UK Government for CCS RD&D could
impact the deployment of this technology

UK business opportunities of moving to a low carbon economy I 8
Ricardo Energy & Environment
Ricardo in Confidence
Ref: Ricardo/ED10039 V7
More innovative low carbon processes may start to be deployed from 2020, but this will be more
predominant post 2030, and are detailed in phase 2 below.
2.3.4 Buildings
Reduce heating and cooling energy demands in buildings, both retrofit and for new
build
Components/controls to improve the energy efficient building e.g. lighting, appliances
Use of heat pumps to provide heat for homes and businesses
There are a range of technologies and options identified for limiting emissions from buildings. The IEA
scenarios place an important focus on reducing heating and cooling energy demands from urban
buildings in order to achieve targets. The IEA identifies near term action (through to 2025), with a focus
on the following, much of which will need to be promoted through relevant policies/targets:
Driving uptake in deep energy renovations of existing buildings
Promote and strive for near zero energy buildings in new construction
Promoting high performance building envelopes – air sealing, insulation, highly insulating
windows and cool roofs.
Increasing the promotion and use of solar thermal and heat pump technology for space heating
and cooling and condensing boilers for gas heating/hot water.
Promotion of heat pump water heaters
Promotion of solid state lighting and other innovative designs while phase out traditional
incandescent and halogen bulbs
Promote efficient appliances and cooking technologies
The UK scenarios cover similar areas including the use of heat pumps and heat networks, the
continuing implementation of insulation, and increased use of heating controls and energy efficient
lighting and appliances within buildings. The CCC scenarios also highlights low carbon heat could be
provided through hybrid heat pumps, or adding hydrogen to the gas grid. There are currently
technological and acceptance issues limiting the implementation of these technologies.
2.3.5 Other Sectors
The IEA scenarios do not focus on Agriculture, Waste and F-gases, but the following is identified from
the UK’s Fifth Carbon Budget scenario:
Agriculture: Emissions could be reduced through a range of measures, for example the reduction of
N
2
O though improved fertiliser use, livestock measures to reduce methane, waste and manure
management, e.g. anaerobic digestion, and improvements in machinery fuel efficiency.
Waste and F-Gases: Under the Fifth Carbon Budget, the improvements in these sectors relate to the
full diversion of biodegradable waste streams from landfill and the replacement of f-gases by low carbon
alternatives in uses such as refrigeration and air conditioning.
2.4 Phase 2: 2031 to 2050 – A more resource efficient world
This phase will build on the work, and foundations provided in earlier years, as well as developments
in new areas. Given the timeframes and uncertainties around technological developments and uptake,
information on the key technologies during this phase is less certain.
However, there are a number of key aspects included in the 5
th
Carbon Budget and IEA 2DS scenarios
that provide an indication of what is expected or required during the period 2030 – 2050 to meet future
targets, such as the UK’s target in 2050 or the IEA 2DS.
2.4.1 Power Generation
Key low carbon technologies are solar PV, onshore wind and hydro
Use of other low carbon generation technologies such as offshore wind will increase

UK business opportunities of moving to a low carbon economy I 9
Ricardo Energy & Environment
Ricardo in Confidence
Ref: Ricardo/ED10039 V7
Other solutions relevant to electricity generation and distribution increase in
deployment, such as smart urban (or city) energy networks.
The IEA 2DS indicates that beyond 2030, the amount of electricity generated by onshore wind, solar
PV, hydro and nuclear continues to increase. However other low carbon power technologies, including
biomass, geothermal, ocean, offshore wind, solar thermal electricity and fossil fuels with CCS, also
increase as the level of renewables increases to 64% of electricity generation.
This is also reflected in the UKs Fifth Carbon Budget scenarios, which expects the decarbonisation of
the power sector will continue in order to provide low carbon electricity, as electricity consumption
increases due to electrification in transport, heat and other applications. CCS also plays an important
part in these scenarios, although alternative routes to decarbonisation such as higher levels of
renewables or nuclear are also considered.
In addition to changes in generation through the deployment of low carbon technologies, the IEA
identifies other solutions are also relevant to electricity generation and its distribution. These include:
District Heating & Cooling networks
Energy from Waste technologies (role of this is identified as modest in IEA report)
Energy recovery at wastewater treatment plants
Use of excess heat from industrial processes through thermal networks
Smarter urban energy networks
Smarter distribution grids
Advanced metering infrastructure
Such technologies may have started to come on-line in the previous phase, but their deployment will
increase throughout this second phase.
2.4.2 Transport
Increased electrification of vehicles, including heavy duty transport
FCEVs – main use for hydrogen in fuel cells
More high speed rail
Stronger uptake of alternative / low carbon fuels, for example biofuels and methane
The IEA highlights that the following trends can be expected during the period 2030-2050:
Annual sales of EVs rising from 28% of light duty vehicles in 2030 to 69% in 2050.
Increased share of FCEVs in this phase – through deployment of FCEVs among light duty
vehicles
Increased electrification of heavy duty transport.
Development of more high speed rail (HSR) to provide an alternative to intra-continental air
travel particularly in non-OECD countries
Expect a stronger uptake of alternative fuels vehicles and low carbon fuels in the longer term.
This aligns with the UKs Fifth Carbon Budget, which expects surface transport to have reached near
full decarbonisation by 2050 through a continuation of technologies implemented in Phase 1. This
includes for example the increasing market uptake of electric vehicles and potential increased uptake
of other technologies such as hydrogen instead of battery electric vehicles
18
.
18
The Fifth carbon Budget includes an alternative scenario in the transport sector which involves the widespread uptake of hydrogen
technologies, rather than battery electric vehicles.

UK business opportunities of moving to a low carbon economy I 10
Ricardo Energy & Environment
Ricardo in Confidence
Ref: Ricardo/ED10039 V7
2.4.3 Industry
Increased deployment of innovative low carbon process technologies, including
integration of CCS into industrial processes
Emission reductions through recycling solutions
The IEA identifies that over the period, 2030-2050, other measures will need to contribute to achieve
the target. This includes using innovative low carbon process technologies (i.e. those not yet
demonstrated, but could become commercially available by 2050), many of which require the integration
of CCS into industrial processes. Examples include the use of CCS in cement kilns, the use of smelt
reduction or direct reduced iron technology in steel making, inert anode technology in aluminium
production and chemical production from biomass based process routes.
In the longer term recycling solutions will also account for emission reductions, primarily in iron and
steel and aluminium sectors, but also plastic recycling to alleviate the demand for primary chemicals.
The UKs Fifth Carbon Budget is consistent with the IEA, in that it identifies CCS will continue be a key
technology to meets targets at least cost, particularly as it will help reduce emission across heavy
industry.
2.4.4 Buildings
Continuing improvements in energy efficiency e.g. lighting and appliances
Use of highly insulated, integrated building envelopes
Integrated heating and cooling solutions with net-zero emissions
Solar solutions – including solar cooling technologies and solar thermal systems
Potential use of hydrogen from natural gas to provide low carbon heat
Building on the implementation of technologies and solutions in Phase 1, the IEA identified the following
examples of what can be expected to be implemented up to 2050, alongside greater enforcement of
near zero energy building standards in new construction:
Deep energy renovations of buildings, including implementation of energy efficiency measures,
such as the use of energy efficient technologies and building envelope improvements.
Energy efficient technology solutions include as advanced lighting e.g. LEDs – continued
deployment in OECD countries and particular focus on other countries, water heating
technologies e.g. instantaneous condensing gas water heaters, heap pump water heaters,
solar thermal systems to provide high proportion of annual water heating load, low cost solar
cooling technologies
Advanced building envelope materials e.g. insulations, windows, including highly insulated,
integrated building envelopes
Reduce cooling and heating demands through improved insulation, use of reflective surfaces
low-emissivity glass windows, solar control, exterior shading, reflective roadways and
pavements, improved doors, air sealing and distribution systems and energy or heat recovery
equipment.
Building design considerations for new construction including orientation, shape, profile,
materials, technology choices, passive ventilation and solar heating contributions,
Geothermal technologies as part of new constructions utilising local natural water resources
Integration of energy efficient building and district energy
Overall, a similar rate of investment in energy saving measures is expected in phases 1 and 2, but 2.5
times the level of savings that needs to realised in phase 2 (2030-2050) compared with phase 1.
The UK’s Fifth Carbon Budget also highlights the potential use of hydrogen produced from natural gas
(with CCS) as an alternative means of providing low carbon heat. This includes converting parts of the

UK business opportunities of moving to a low carbon economy I 11
Ricardo Energy & Environment
Ricardo in Confidence
Ref: Ricardo/ED10039 V7
gas grid to hydrogen use, together with the use of hydrogen boilers to provide heat for residential,
commercial and public buildings.
2.4.5 Greenhouse gas removal technologies
In addition, the CCC report ‘UK climate action following the Paris agreement’
19
includes some further
indications of the potential trends that could be increasingly relevant for this phase in order to meet the
UK’s 2050 target.
Greenhouse Gas Removal Technologies (GGR) are already included as part of the scenario to 2050 in
terms of bioenergy with carbon capture and storage, afforestation and wood in construction, with the
removal of up to 67 MtCO2/year from these options.
2.5 Phase 3: 2051 to 2100 – A sustainable, low carbon world
Continued deployment of low carbon technologies from earlier phases, though
deployment rates may now be declining
Focus on hard to decarbonise sectors such as aviation, agriculture and parts of the
industry
Refined fuel demand decrease due to electrification and/or switch to hydrogen
Potential for geoengineering and other greenhouse gas removal technologies
Information beyond 2050 on the types of technologies that will be implemented is limited, and tends to
relate to higher level trends rather than sector specific actions due to the uncertainty of what will happen
in this phase. While the ETP 2016 2DS and the UK’s Fifth carbon Budget do not give any information
for the period beyond 2050, the CCC report ‘UK climate action following the Paris agreement’
20
highlights the following in relation to continued savings beyond 2050:
Continued deployment of low-carbon measures to replace high carbon stock e.g. vehicles
power generators, heating systems
Continued displacement of fossil fuelled engines by electric and hydrogen vehicles. In addition,
motorcycles, construction vehicles and aircraft support vehicles could be fully decarbonised.
Increased use of heat pumps, district heating and low carbon hydrogen in buildings to reduce
emission. Potential for a more rapid move away from gas for heating, should it become
uneconomical to maintain the gas grid.
After 2050 refining output and refining emissions will continue to reduce as transport and
heating are electrified or switched to hydrogen, lessening the demand for refined fuels.
In addition, beyond 2050 there will be a need to focus on sectors where emissions are still expected to
remain. This includes aviation, agriculture and parts of industry.
Within the aviation sector some further emission reductions could be possible through
improvements in fuel efficiency and take up of biofuels, however further reductions would
require further options. This could include for example; advanced low carbon fuels, alternative
propulsion methods e.g. LNG, hydrogen, nuclear, solar, hybrid planes, greater shifts away from
aviation to alternatives by consumers
Emissions from agriculture will be mainly from livestock and fertilisation of soils. Emissions
could potentially be reduced beyond 2050, for example through increased diet change, food
waste reduction, breakthroughs in genetically modified livestock, novel crops and precision
livestock farming.
It is envisaged that remaining emissions from industry will be primarily from fuel combustion,
process emissions and residual CCS emissions from manufacturing (such as iron & steel, food
& drink), water management and construction sectors. Further electrification or the use of
hydrogen may be possible to reduce fuel combustion emissions. Process and CCS emissions
19
Committee on Climate Change (2016) UK climate action following the Paris Agreement
20
Committee on Climate Change (2016) UK climate action following the Paris Agreement

UK business opportunities of moving to a low carbon economy I 12
Ricardo Energy & Environment
Ricardo in Confidence
Ref: Ricardo/ED10039 V7
will be more difficult to decarbonise. The sector may be able to reduce emission through less
carbon intensive products and increased reuse of products and materials.
The report also covers Geoengineering options in order to help achieve targets, including spraying
reflective particles into the upper atmosphere, enhancing the reflectivity of clouds by spraying particles,
and enhancing the reflectivity of land surfaces. However, there is a larger degree of uncertainty
regarding such approaches and further exploration of these options would be required. Greenhouse
Gas Removal, which is already included in Phase 2, would also have a potential role in this phase, as
other options of greenhouse gas removal as developed.
Other sources do provide scenarios with some information on the period 2050-2100. The recent report
‘Bending the Curve’, published by the University of California
21
identifies a series of clusters for moving
towards a low carbon economy:
Science Solutions Cluster
Societal Transformation Solutions Cluster
Governance Solutions Cluster
Market- and Regulations-Based Solutions Cluster
Technology-Based Solutions Cluster
Natural and Managed Ecosystem Solutions Cluster
This highlights the wider activities in addition to technology based solutions that need to be considered.
For the technology based cluster, the report indicates the various solutions, if fully implemented, could
reduce global warming by as much as 1.5 degrees Celsius by 2100. Therefore, solutions identified
would continue to be implemented beyond 2050. This includes technologies such as photovoltaics,
wind turbines, battery and hydrogen fuel cell electric light-duty vehicles and more efficient end-use
devices, together with innovations for the complete electrification of energy and transport systems and
improvements to building efficiency.
2.6 Timeline Analysis Conclusions
This section has identified the key technologies likely to be required to move towards a low carbon
economy, based on the IEA’s ETP 2016 and the UK’s Fifth carbon Budget scenarios.
The overall approach to transition to a low carbon economy is:
Implement known and developing energy efficiency measures
Deploy technologies that have been developed and are known. Costs for some of these will be
expected to decrease with deployment, as has been the case recently with solar photovoltaic
cells
Demonstrate other technologies that are close to deployment
This leaves hard-to-reduce sectors, such as aviation, where further innovation is likely to be
required
Greenhouse gas reduction technologies may be required to reach zero net emissions in the
second half of the century
The expected deployment of technologies in the UK and globally is broadly similar. There are some
obvious differences based on geography – offshore wind is likely to provide a higher proportion
electricity for UK than globally and solar PV a lower proportion.
Clearly there is a range of technologies that can be implemented, and also a degree of uncertainty in
terms of when they will be deployed in reality. However key trends for each phase have been
identified and are in Table 4 below.
21
and http://www.ccacoalition.org/en/resources/executive-summary-report-bending-curve-10-scalable-solutions-carbon-neutrality-and-climate

UK business opportunities of moving to a low carbon economy I 13
Ricardo Energy & Environment
Ricardo in Confidence
Ref: Ricardo/ED10039 V7
Table 4: Summary of technology requirements by emissions-reduction sector and time
Emissions-
reduction
sector
2017-2030
2030-2050
2050-2100
Power
generation
Key technologies globally
include solar PV, on-
shore wind, hydro and
nuclear
Key technologies within
the UK will include
renewables including
offshore wind, nuclear,
CCS and bioenergy
The initial deployment of
less mature technologies
will be required
Key low carbon technologies
are solar PV, onshore wind
and hydro
Deployment of other low
carbon generation
technologies such as offshore
wind will increase
Other solutions relevant to
electricity generation and
distribution increase in
deployment such as smart
urban (or city) energy
networks
Continued
deployment of low
carbon technologies
from earlier phases
though deployment
rates may be
declining
Focus on aviation,
agriculture and parts
of the industry
sectors
Refined fuel
demand decrease
due to electrification
and/or switch to
hydrogen
Potential for
geoengineering and
other greenhouse
gas removal
technologies
Transport
Energy efficiency
improvements in
conventional internal
combustion engines and
use of biofuels
Ongoing electrification of
vehicles
Technologies to improve
efficiency of different
transport modes such as
materials substitution to
reduce weight, advanced
lubricants and advanced
aerodynamics
Increased electrification of
vehicles, including heavy duty
transport
FCEVs – main use for
hydrogen in fuel cells
More high speed rail
Stronger uptake of alternative
/ low carbon fuels, for example
biofuels and methane
Industry
Deployment of energy
efficiency measures
(BAT) within industrial
sectors
Use of low carbon fuels
and feedstock and
increased recovery of
excess energy
CCS identified as key
technology within the UK
Increased deployment of
innovative low carbon process
technologies, including
integration of CCS into
industrial processes
Emission reductions through
recycling solutions
Buildings
Reduce heating and
cooling energy demands
in buildings both retrofit
and for new build
Components/ controls to
improve the energy
efficient building e.g.
lighting, appliances
Use of heat pumps to
provide heat for homes
and businesses
Continuing improvements in
energy efficiency e.g. lighting
and appliances
Use of highly insulated,
integrated building envelopes
Integrated heating and cooling
solutions with net-zero
emissions
Solar solutions – including
solar cooling technologies and
solar thermal systems
Potential use of hydrogen
from natural gas to provide
low carbon heat
UK business opportunities of moving to a low carbon economy I 14
Ricardo Energy & Environment
Ricardo in Confidence
Ref: Ricardo/ED10039 V7
3 Current UK Competitive Position
Used two methods to assess the size of the UK LCE in 2015
Estimated employment of 230,000 to 450,000
Estimated turnover of £42 billion to £120 billion
Broadly stable over 2013 to 2015
3.1 Low carbon technology RD&D
Over the last 15 years, the UK has made a substantial investment in energy and low carbon technology
research, development and demonstration (RD&D). For example, the Research Councils UK (RCUK)
Energy Programme invested £839 million between 2003 and 2011, and a further £625 million is being
invested between 2012 and 2018. Analysis by the programme managers at EPSRC, indicates that this
investment has been made across a wide range of technical areas, including renewable energy,
alternative fuels, low carbon transport, nuclear power, energy storage and CCS, as well as energy
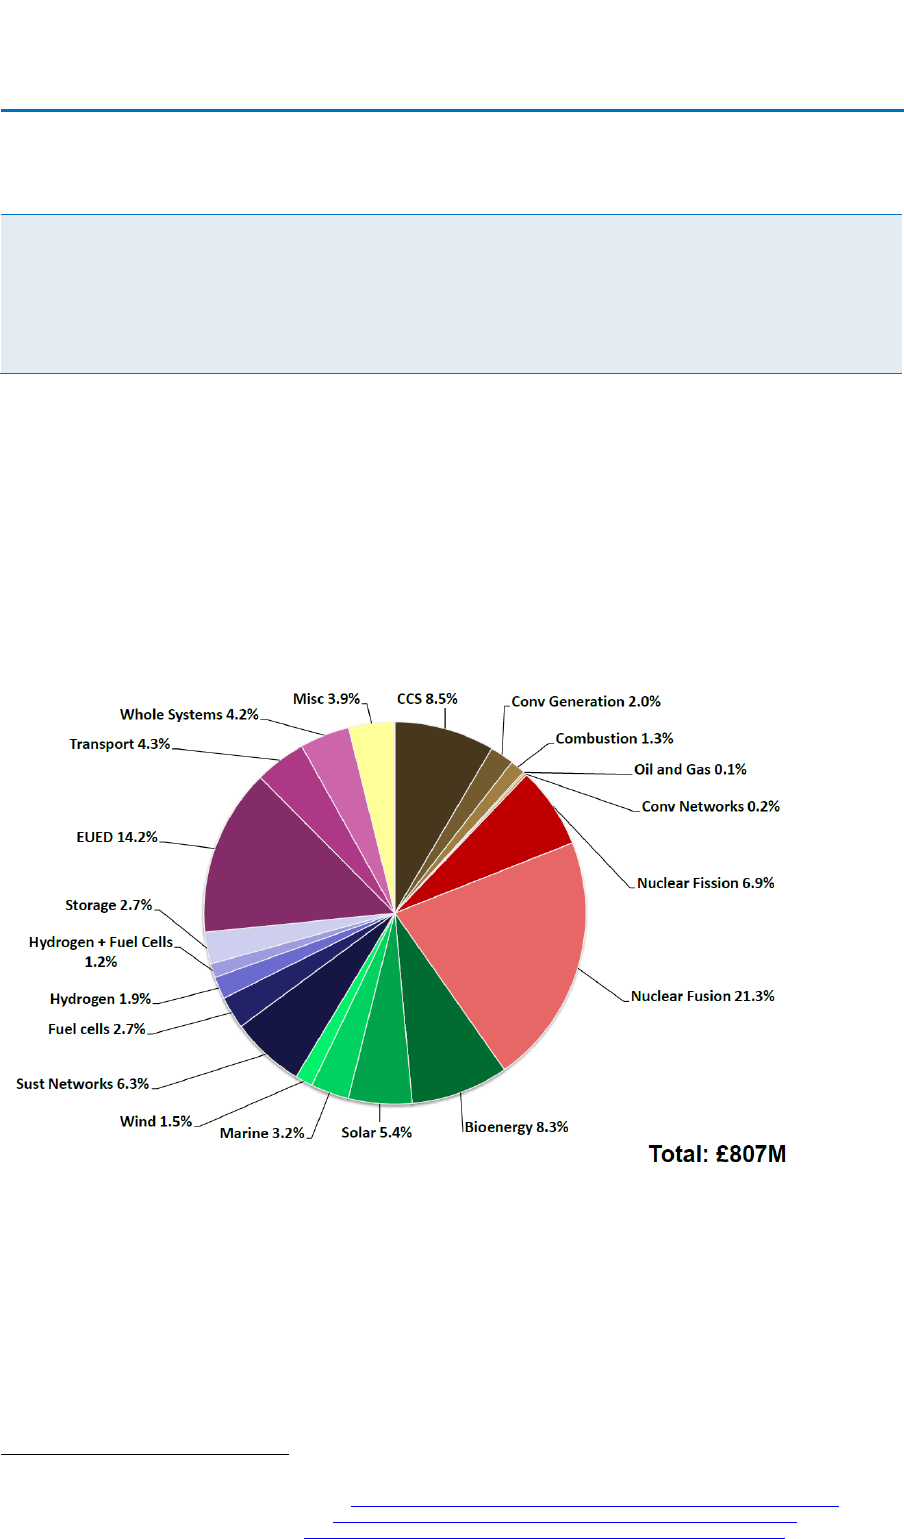
efficient electricity and heat generation, distribution and end use, as illustrated in the Figure 4 below.
Figure 4: Breakdown of Energy Programme investment up to 2014 by technology area
22
.
About one third of all RCUK research grants are made through the Supergen initiative in sustainable
power generation and supply
23
,
24
,
25
, which has provided core funding to 14 hubs undertaking basic
research on energy technologies at low state of technology readiness (TRL) since 2001, and is
continuing to support six hubs under its fourth phase of investment working on:
Alternative energy carriers (such as hydrogen),
Bioenergy,
Energy networks,
Energy storage,
22
Research Councils UK, Energy Portfolio Breakdown, EPRSC, April 2014
23
Supergen Introduction and background, RCUK 2016, http://www.rcuk.ac.uk/documents/energy/supergenintroductionbackground-pdf/
24
Supergen Draft Programme Strategy, RCUK 2016, http://www.rcuk.ac.uk/documents/energy/supergenprogrammestrategy-pdf/
25
Supergen Benchmarking report, RCUK, 2016, http://www.rcuk.ac.uk/documents/energy/supergenphase3-benchmarking-pdf/

UK business opportunities of moving to a low carbon economy I 15
Ricardo Energy & Environment
Ricardo in Confidence
Ref: Ricardo/ED10039 V7
Fuel cells,
Offshore renewable energy,
The RCUK also has 10 national research centres which act as focal points for mid TRL applied
research and development in the energy technologies, including:
The UK Energy Research Centre (UKERC),
The National Centre for Energy Systems Integration (CESI),
The EPSRC Centre for Power Electronics, CCS Research Centre (UKCCSRC),
The Dynamics of Energy, Mobility and Demand (DEMAND) Centre
The Centre for Energy Epidemiology (CEE)
The Centre on Innovation and Energy Demand (CIED),
The Centre for Industrial Energy, Materials and Products (CIE-MAP),
The Interdisciplinary centre for Storage, Transformation and Upgrading of Thermal Energy (i-
STUTE).
The Centre for Sustainable Energy Use in Food Chains (CSEF).
In addition, 8 out of 11 Innovate UK catapult centres
26
are commercialising research work in energy or
supporting the development of sustainable solutions for UK manufacturing, business, and society:
The Offshore Renewable Energy Catapult,
The Energy Systems Catapult,
The Future Cities Catapult,
The Transport Systems Catapult,
The High Value Manufacturing Catapult,
The Compound Semiconductor Applications Catapult,
The Satellite Applications Catapult,
The Digital Catapult.
As part of its mission to support innovation, increased productivity and growth in UK business Innovative
UK also funds a range of industrial research, development and demonstration (RD&D) projects
27
,, and
knowledge transfer networks (KTN) in many sectors of the economy
28
that support business seeking to
develop new materials, goods and services for the low carbon economy and specialist interest groups
in emerging technology areas such as sustainability and the circular economy and energy harvesting.
These investments in research and innovation, and others related to the wider impact of climate change
on business and society (e.g. adaptation), mean that the UK is well placed to obtain a share of the
growing market for the materials, goods and services needed by the transition to a low carbon economy
provided concerted action is taken by suppliers and government to ramp up export activities
29
.
Technologies where UK is investing in research and innovation are candidates for UK opportunities
from transition to a low carbon economy.
3.2 UK strengths in low carbon innovation
During our review, we identified a substantial volume of world class research, and innovative product
designs in all of the areas that we made estimates of potential global market size (See section 4).
In many cases, the UK research has the potential to produce a new generation of low carbon products
and services, and work is under way to commercialise the results through the Catapult Centres and
Industrial Research Centres. (See Section )
26
https://catapult.org.uk/about-us/about-catapult/
27
Innovate UK, Delivery Plan 2016/17,
https://www.gov.uk/government/uploads/system/uploads/attachment_data/file/514962/CO300_Innovate_UK_Delivery_Plan_2016_2017_WEB.pdf
28
https://admin.ktn-uk.co.uk/app/uploads/2016/09/KTN-Annual-Report-2015_2016.pdf
29
https://www.carbontrust.com/media/504208/ctc829-a-must-win-capitalising-on-new-global-low-carbon-markets.pdf

UK business opportunities of moving to a low carbon economy I 16
Ricardo Energy & Environment
Ricardo in Confidence
Ref: Ricardo/ED10039 V7
With the aid of our experts and stakeholder feedback, we have assessed whether there is a low, medium
or high potential for UK business to capture market share in each of the main segments of the UK low
carbon economy market (Table 5) and identified some examples of areas where the UK currently has
particularly strength based on an assessments of UK low carbon capabilities produced by the Foreign
& Commonwealth Office (FCO), UK Trade & Industry (UKTI) and Carbon Trust
30
and Low Carbon
Coordination Innovation Group (LCCIG)
31
.
Table 5: Assessment of UK potential to capture market share and examples of current UK strengths
Low carbon economy (LCE) sector
Potential to
capture market
share
Examples of current UK strengths
Energy efficient products
Medium
Smart Grids, advanced building design,
materials and manufacturing systems
Energy from waste and biomass
Low to Medium
Biofuels, waste recycling techniques
Low carbon electricity
Medium
Off-shore wind, energy storage, solar PV
Low carbon services
High
Finance, insurance, consultancy
Low emission vehicles, infrastructure,
fuels cells and energy storage
Medium to high
Power systems & transmissions,
batteries, logistics, telematics,
Other products and services
Medium to high
Membranes, catalysts, bioprocessing
These ratings are intended as high level assessments looking at the short to medium term potential for
UK business to capture global market share by 2030. The list of example UK strengths is not exhaustive,
and there are other promising but less well known technologies that could be included from sector
strategies and sector benchmarking reports
32
by BIS and regional/country strategies
33
.
If we look over the immediate time horizon, research is underway to develop the next generation of
innovations that will be needed to enable and deliver the circular economy and on the technologies that
will enable UK society and the global economy to adapt to the impact of climate change. We expect
that many of these technologies will take advantage of the UK’s strengths in advanced manufacturing
and materials; robotic, autonomous and digital systems; and energy storage.
3.3 UK Export Performance
Analysis of global production and trade data between 2010 and 2014
34
, indicates that 75% of UK exports
(by Value) related to:
Financial services (11.6%)
Wholesale and retail products (11.5%)
Transport equipment (11.1%)
Machinery and electricity products (9%)
Chemicals and related products (8.2%)
Business services (8.1%)
Professional services (6.1%)
Metals / Metal Products (4.9%)
30
https://www.gov.uk/government/uploads/system/uploads/attachment_data/file/199886/UK_Capabilities_Report_EN.pdf
31
https://www.carbontrust.com/media/190038/tina-bioenergy-summary-report.pdf
32
https://www.gov.uk/government/uploads/system/uploads/attachment_data/file/34647/12-1207-benchmarking-uk-competitiveness-in-the-global-
economy.pdf
33
2014-17 Business Plan, Scottish Enterprise, https://www.scottish-enterprise.com/~/media/5793a121a3ff431a8453f4b0c83b8744.ashx
34
As published in the World Input-Output Database, http://www.wiod.org/home. For details of the method see: Timmer, M. P., Dietzenbacher, E.,
Los, B., Stehrer, R. and de Vries, G. J. (2015), "An Illustrated User Guide to the World Input–Output Database: the Case of Global Automotive
Production", Review of International Economics., 23: 575–605

UK business opportunities of moving to a low carbon economy I 17
Ricardo Energy & Environment
Ricardo in Confidence
Ref: Ricardo/ED10039 V7
Computer and information services (4.2%)
In 2014, UK business captured approximately 3.6% of global export market. Sectors that captured more
than this percentage of the global export market for their particular category of materials, goods services
are considered to have a comparative advantage
35
. Of these nine sector groupings listed above, six of
exceeded this threshold, whilst three (metals / metal products, chemicals and related products, and
machinery / electrical products) do not. In part, these market shares reflect the shift in UK industry
towards production of higher value added materials, goods and services, and the globalised nature of
the some manufacturing sectors. The six sectors groupings with comparative advantage are broadly
similar to the sectors identified by BIS’s benchmarking of revealed comparative advantage of in 2003
and 2008
36
, although mineral products and the food and drink sector have lost competitive position.
The results of analysis for all sector groupings are shown in Figure 5. The UK’s share of the global
export market for Low Carbon Economy related materials, goods and services might be maximised by
helping sectors that generate a significant share of UK exports to develop new products, and by
investment in sectors with future growth potential where the UK has a competitive advantage.
Figure 5: Analysis of UK Exports and UK Share of the Global Export Market by sector grouping
Markets which represent a relatively high proportion of UK exports and particularly where the UK has
a high share of global exports give areas where low carbon opportunities may start from a strong
current base.
Research and innovation investments (Section 3.1) may lead to enhancing the UK share of global
exports.
3.4 Current UK low carbon goods and services market
The current UK market for low carbon goods and services has been estimated using an established
method described in detail in Appendix 1.
A baseline for the market was set with the publication of the report ‘The size and performance of the
UK low carbon economy’ by BIS in 2015
37
. This work, which was led by TBR, set out employment,
turnover and gross value added (GVA) data for a range of sectors that made up the low carbon
economy, as of 2013.
35
http://www.rbs.com/content/dam/rbs/Documents/News/2014/08/UK%20export%20performance%20August%202014.pdf
36
https://www.gov.uk/government/uploads/system/uploads/attachment_data/file/34647/12-1207-benchmarking-uk-competitiveness-in-the-global-
economy.pdf
37
The Size and performance of the UK low carbon economy, BIS, March 2015.

UK business opportunities of moving to a low carbon economy I 18
Ricardo Energy & Environment
Ricardo in Confidence
Ref: Ricardo/ED10039 V7
The current work sought to update the BIS baseline with data for 2015. The analysis is based on the
performance of 5,600 businesses known to operate across the low carbon economy and which were in
existence in both years, viz 2013 and 2015.
Subsequent to the publication of the BIS report, ONS undertook survey work to generate its own data
for the low carbon and renewable energy economy. While there was significant commonality between
the sectors used, there were also important definitional differences such as in the way supply chain
effects were incorporated.
Headline data by group is presented below in Table 6 to Table 8 to show changes in employment,
turnover and GVA between 2013 and 2015.
Table 6: Low carbon employment 2013 – 2015
Sector Group
2013
2015
Change
Energy Efficient products
94,200
90,900
-3.5%
Low carbon electricity
140,800
139,400
-1.0%
Low carbon heat
32,600
30,800
-5.4%
Low carbon services
28,000
28,600
2.0%
Low emission vehicles, infrastructure, fuels cells
and energy storage
18,100
18,400
1.5%
Waste processing, energy from waste and biomass
146,900
141,300
-3.8%
Total
460,600
449,400
-2.4%
Source: TBR/OrtusER 2017
The view is that, overall, the low carbon economy lost some jobs in the period between 2013 and 2015.
However, as the data only covers one year (2015), the change may not be statistically significant so
should be treated with caution. The BIS report showed that between 2010 and 2013 employment in the
low carbon economy grew by 3.8% per annum
38
.
Table 7: Low carbon turnover (£M) 2013 – 2015
Sector Group
2013
2015
Change
Energy efficient products
16,400
17,000
4.1%
Low carbon electricity
33,300
29,500
-11.4%
Low carbon heat
4,900
5,100
4.2%
Low carbon services
3,700
4,000
8.5%
Low emission vehicles, infrastructure, fuels
cells and energy storage
8,800
9,600
10.1%
Waste processing, energy from waste and
biomass
54,600
57,300
5.0%
Total
121,700
122,600
0.8%
Source: TBR/OrtusER 2017
The turnover data are also broadly static, though the change between the two years is marginally
positive. Turnover over the period 2010 to 2013, grew by 7.6% on an annual basis
39
.
38
Ibid, see Table 31.
39
Ibid, see Table 33.

UK business opportunities of moving to a low carbon economy I 19
Ricardo Energy & Environment
Ricardo in Confidence
Ref: Ricardo/ED10039 V7
The differences in growth rates between the sector groupings between 2013 and 2015, also suggest
that additional data are needed before definitive judgements can be made on the way the low carbon
economy is performing.
Table 8: Low carbon GVA (£M) 2013 – 2015
Sector Group
2013
2015
Change
Energy efficient products
7,300
7,300
-1.3%
Low carbon electricity
10,400
10,500
0.1%
Low carbon heat
1,700
1,800
5.8%
Low carbon services
1,800
2,000
8.8%
Low emission vehicles, infrastructure, fuels
cells and energy storage
1,300
1,300
1.1%
Waste processing, energy from waste and
biomass
21,900
19,200
-12.3%
Total
44,500
42,000
-5.6%
Source: TBR/OrtusER 2017
Overall, the data suggest that any growth identified in the work for BIS may have stalled. However, the
data are not robust enough to provide a definitive statement. In the period 2010 to 2013, there was
annual growth of 8.7%
40
.
The lack of consistency between the three data sets could also be interpreted as indicating changes
within the low carbon sector, e.g. margins are tightening in some sectors, yet loosening in others,
especially as the nature of activity changes, e.g. nuclear focuses on decommissioning, offshore wind
farms increase output and technical/financial challenges continue to be felt in marine. However, the
previously mentioned caution is reiterated.
For comparison, ONS data from the 2013 and 2014 surveys are presented in Table 9 and Table 10
below. These data show a possible slow down, though ONS urge caution due to large margins of
error, along with differences in method across the two years..
Table 9: ONS low carbon and renewable energy direct employment 2013 - 2014
Low carbon economy (LCE) sector group
2014
2015
Change
Energy efficient products
155,500
142,500
-8.4%
Energy from waste and biomass
11,500
10,000
-13.0%
Low carbon electricity
40,500
47,000
16.0%
Low carbon heat
7,000
3,500
-50.0%
Low carbon services
13,000
15,000
15.4%
Low emission vehicles, infrastructure, fuels cells
and energy storage
11,000
15,000
36.4%
Total
238,500
233,000
-2.3%
Source: ONS
40
Ibid, see Table 35.

UK business opportunities of moving to a low carbon economy I 20
Ricardo Energy & Environment
Ricardo in Confidence
Ref: Ricardo/ED10039 V7
Table 10: ONS low carbon and renewable energy direct turnover (£M) 2013 - 2014
Low carbon economy (LCE) sector group
2014
2015
Change
Energy efficient products
21,900
19,900
-9.1%
Energy from waste and biomass
5,600
4,400
-21%
Low carbon electricity
12,400
12,200
-1.6%
Low carbon heat
1,400
1,200
-14%
Low carbon services
1,200
700
-44%
Low emission vehicles, infrastructure, fuels cells
and energy storage
3,800
3,800
-
Total
46,300
42,200
-8.9%
Source: ONS
The similarities between the data showing change in Table 6 and Table 9 indicate a degree of
consistency. It should be noted that the ONS data are for 2014 and 2015, rather than 2013 and 2015.
The apparent lack of growth, compared to the period up to 2013 would seem consistent with changes
to key policy measures, e.g. reduction in feed in tariffs and local challenges to planning consents for
onshore wind.
Direct comparison of the data from the two sources cannot be made due to the differences in definition.
It could be suggested that the results in Table 6 to Table 9 omit some activities that could be considered
as part of the low carbon economy. For instance, activities associated with adaptation to climate change
are not included. As an initial trial, further analysis was undertaken to investigate the ‘Adaptation’ sector.
(See Appendix 1B). This sector includes the design, production, installation and maintenance of
products and services aimed at adapting to the effects of climate change.

UK business opportunities of moving to a low carbon economy I 21
Ricardo Energy & Environment
Ricardo in Confidence
Ref: Ricardo/ED10039 V7
4 Global opportunities for UK Manufacturing
Analysis suggests:
UK LCE could grow from 2% of UK total output in 2015 to up to around 8% by 2030 and
13% by 2050
Compound annual growth rates of 11% per annum between 2015 and 2030 and 4% per
annum between 2030 and 2050
UK LCE market size of between £230 billion and £640 billion in 2030 and between £510
billion and £1,400 billion in 2050
Employment associated with the LCE between 1.1 and 2.4 million in 2030 and between 2.5
and 5.0 million in 2050
4.1 Approach to the quantification of market opportunity
We approached the quantification of the size of market opportunity for UK manufacturing in six stages:
1. Assessing the current size of the UK and global market for selected low carbon technologies
and services, based on reported levels of deployment and market research reports.
2. Deriving estimates of the future global market size for the selected low carbon technologies
and services in 2030 and 2050, based on the IEA’s 2DS scenario and technology roadmaps,
national technology cost forecasts and published estimates of future global market sizes.
3. Deriving estimates of future UK home market size for the selected low carbon technologies and
services in 2030 and 2050, based on CCC scenarios and sector analysis, or pro rata estimates
of UK market size based the ratio of UK GDP to global GDP or future electricity demand.
4. Making assumptions about the proportion of the total global market size that the UK might
expect to capture, based on the UK’s current share of global exports in the most relevant sector
grouping (Figure 5) and the proportion of the global sector output that is traded internationally.
5. Combining the estimates of UK home and export market and exploring variants of the IEA
2DSand CCC’s scenarios to obtain the estimated UK share of the global market for the selected
low carbon technologies and services in 2015, 2030 and 2050, expressed as a range.
Deriving compound annual rates of growth for groups of technology areas, and applying these to the
UK low carbon market statistics (Table 6 to Table 10) to obtain a ball park estimate of the overall
potential size of the UK market for low carbon materials, goods and services in 2030 and 2050.
4.2 Future global low carbon economy markets
Global market opportunities arising from the transition to a low carbon economy were developed using
an iterative process as illustrated in Figure 6.
An initial review of roadmaps for transition to a low carbon economy identified over 500 discrete
opportunities, which were reduced to 100 potential new global export markets by screening out:
o Duplicates and “generic” opportunities e.g. increased energy efficiency
o Well established technologies & incremental developments
o Opportunities not applicable to the UK market
o Difficult to value niche market opportunities
o Out of scope topics (e.g. nuclear energy)
The remaining opportunities were grouped into 50 market segments (see Appendix A4.4) of
which 25 were selected in consultation with CCC for further assessment, including opportunities
in areas:
o Of existing, particular or emerging UK strength in the global export market (18)
o Where the UK is considered to be lagging behind major competitors, competing with
lower cost economies, or constrained by resource availability (5)
o At an early stage of technology development (2)

UK business opportunities of moving to a low carbon economy I 22
Ricardo Energy & Environment
Ricardo in Confidence
Ref: Ricardo/ED10039 V7
It was not intended that this work should be comprehensive in considering all possible opportunities for
the UK arising from transition to a low carbon economy. Considering the seven low carbon economy
sectors used by ONS and TBR (See Table 6), the approach has been:
Low carbon electricity – this has been considered in detail with separate estimates for all of the
sub-sectors apart from hydropower and nuclear
Low emission vehicles – this has been considered in detail with separate estimates for six
aspects of low emission vehicles
Low carbon services – low carbon finance and insurance have been considered but not other
low carbon advisory services
Low carbon heat - has not been considered
Energy from waste and biomass – one example, that of biofuels has been considered
Energy efficient products – selected examples have been considered
The alignment of the sectors considered by ONS and TBR and the opportunities analysed further are
in Appendix 2.
In addition, we also examined two areas of the LCE not covered by ONS:
Adaptation – an initial estimate has been made of the size of the opportunity
Circular economy - an initial estimate has been made of the size of the opportunity (see Box
1).
Figure 6: Iterative approach to selected opportunities for UK from transition to low carbon economy

UK business opportunities of moving to a low carbon economy I 23
Ricardo Energy & Environment
Ricardo in Confidence
Ref: Ricardo/ED10039 V7
4.2.1 Low Carbon Electricity
Our estimates of the potential global market size for six selected opportunities within the low carbon
electricity sector are given in Figure 7. These identified a potential global market size of between £260
bn and £360 bn per year in 2030 and £580 bn and £900 bn per year in 2050, with a compound annual
growth rate (CAGR) of 5 to 7% between 2015 and 2030 and 4% to 5% between 2030 and 2050.
Our assessment of the potential future global market size for products and services related to the
generation of low carbon electricity is based on the forecast level of electricity generated from wind,
marine and solar PV technologies in 2030 and 2050, compared with reported generation in 2013.
The annual capital investment required to deliver these electricity outputs was estimated using the
investment costs per GW and anticipated technology cost reductions outlined in the IEA’s technology
roadmaps
41
. For Solar PV, capital costs were based on NREL forecasts of future technology costs
42
,
as there has been a significant reduction in solar PV costs since the IEA roadmap was prepared.
The annual capital investment in Carbon Capture and Storage (CCS) schemes was estimated from
IEA’s review of progress of CCS technology development
43
. The “No CCS in Power” (NCCP) variant of
the 2DS scenario was used to generate high estimates for renewables and low estimates for CCS.
The capital investment associated with Energy Storage needed to enable variable renewables to deliver
between 67% and 75% of global electricity generation by 2050 was also factored into the assessment.
These assessments included an allowance for end-of-life replacement (normally after 20 years), but did
not include the costs of Operation and Maintenance (O&M) which potentially could increase the market
for products and services by 12% to 140% depending on the technology and location of deployment.
Figure 7: Estimated global market size for selected low carbon electricity sectors in 2015, 2030 and 2050
41
https://www.iea.org/roadmaps/
42
http://www.nrel.gov/analysis/data_tech_baseline.html
43
https://www.iea.org/publications/freepublications/publication/20YearsofCarbonCaptureandStorage_WEB.pdf
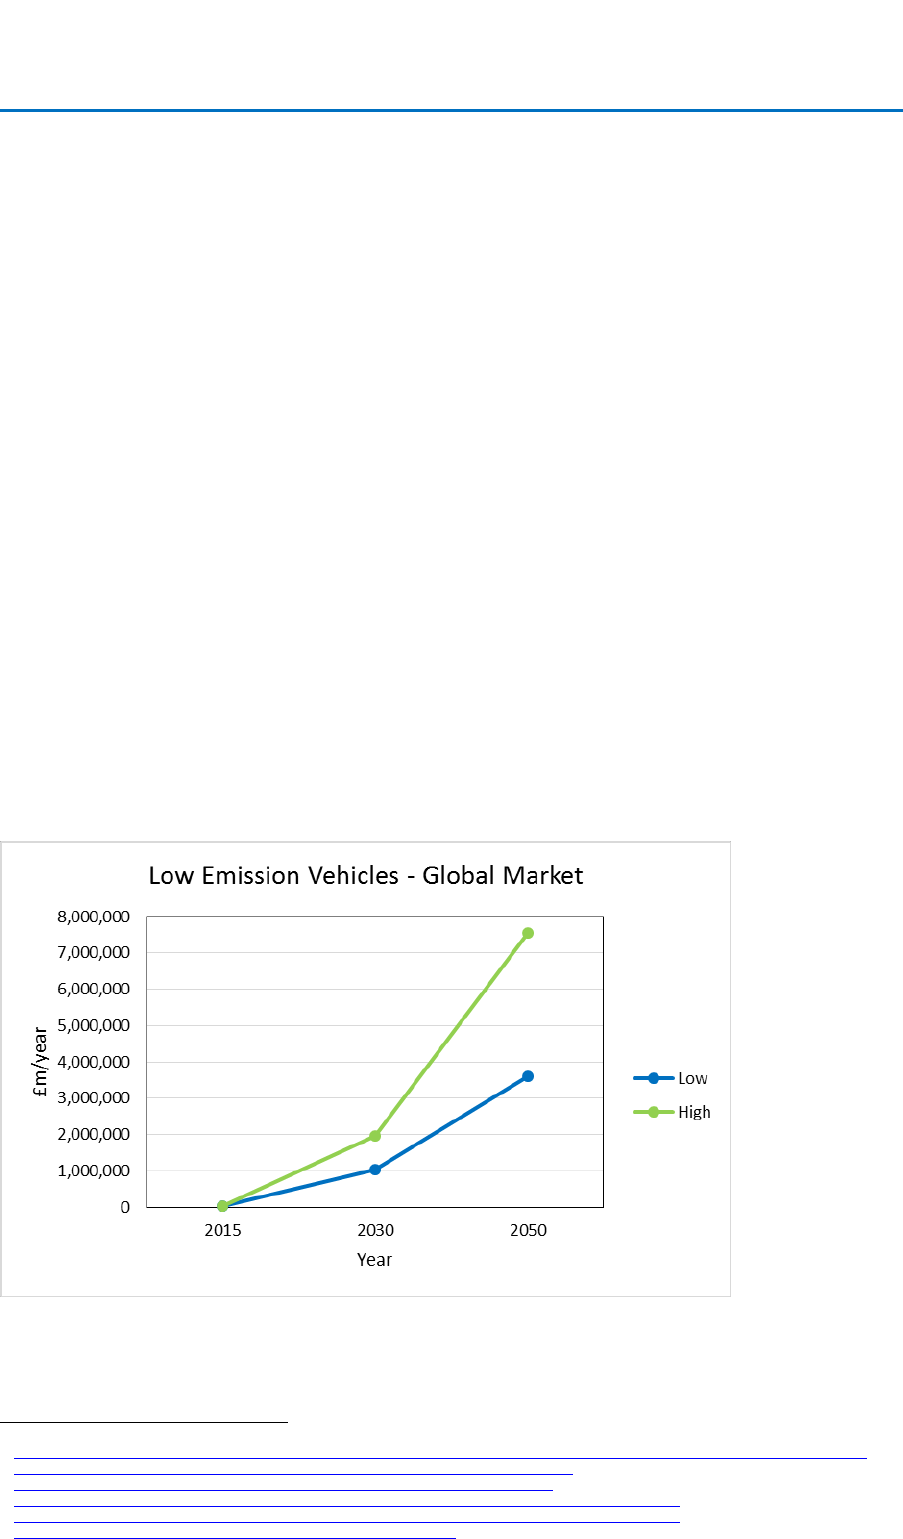
UK business opportunities of moving to a low carbon economy I 24
Ricardo Energy & Environment
Ricardo in Confidence
Ref: Ricardo/ED10039 V7
4.2.2 Low Emission Vehicles
Our estimates of the potential global market size for five selected opportunities within the low emission
vehicles are given in Figure 8. These identified a potential global market size of between £1.0 tn and
£2.0 tn per year in 2030 and £3.6 tn and £7.6 tn per year in 2050, with a CAGR of 26% to 29% between
2015 and 2030 and 6% to 7% between 2030 and 2050.
Our assessment of the potential future global market size for products and services related to low
emission vehicles is based on the forecast sales of light duty Battery Electric Vehicles (BEV), Plug-in
Hybrid Electric Vehicles (PHEV) and Fuel Cell Electric Vehicles (FCEV) under the 2011 IEA road map
for Electric and Plug-in Hybrid Vehicles
44
and the 2016 Global EV outlook
45
. These assume a much
higher rate of EV deployment is needed post 2030 to avoid temperature increases above 2
o
C than
some other market projections
46
. The High Hydrogen (“High H
2
”) variant of the 2DS scenario was used
to generate high and low estimates with FCEV displacing sales of PHEV under the high scenario
47
,
The annual capital investment required to realise the forecast global sales of each type of Electric
Vehicle was estimated using the initial purchase cost of vehicles and anticipated cost reductions
published in the technical annex to the 2015 IEA Technology Road Map for Hydrogen and Fuel Cells
48
.
The proportion of the annual investment in EVs related to transmission systems, electric motors, and
batteries was also calculated, but excluded from the overall total market size to avoid double counting.
The annual capital investment required to provide public and workplace charging solutions to support
the uptake of electric vehicles, and of building a hydrogen refuelling infrastructure was also included.
The annual revenue from logistics and telematics services associated with the provision of Integrated
Mobility Products and Services and Advanced Driver Assistance Systems needed to improve overall
transport integration and efficiency was also estimated based on a 2015 report by Frost & Sullivan
49
.
These assessments do not include the costs of Operation and Maintenance (O&M) of electric vehicles
or supporting infrastructure, or the costs of deploying medium and heavy duty electric vehicles.
Figure 8: Estimated global market size for selected low emission vehicles in 2015, 2030 and 2050
44
https://www.iea.org/publications/freepublications/publication/technology-roadmap-electric-and-plug-in-hybrid-electric-vehicles-evphev.html
45
https://www.iea.org/publications/freepublications/publication/Global_EV_Outlook_2016.pdf
46
https://about.bnef.com/blog/electric-vehicles-to-be-35-of-global-new-car-sales-by-2040/
47
http://www.iea.org/publications/freepublications/publication/TechnologyRoadmapHydrogenandFuelCells.pdf
48
https://www.iea.org/media/freepublications/technologyroadmaps/TechnologyRoadmapHydrogen_Annex.pdf
49
https://www.sitra.fi/julkaisut/Selvityksi%C3%A4-sarja/Selvityksia102.pdf
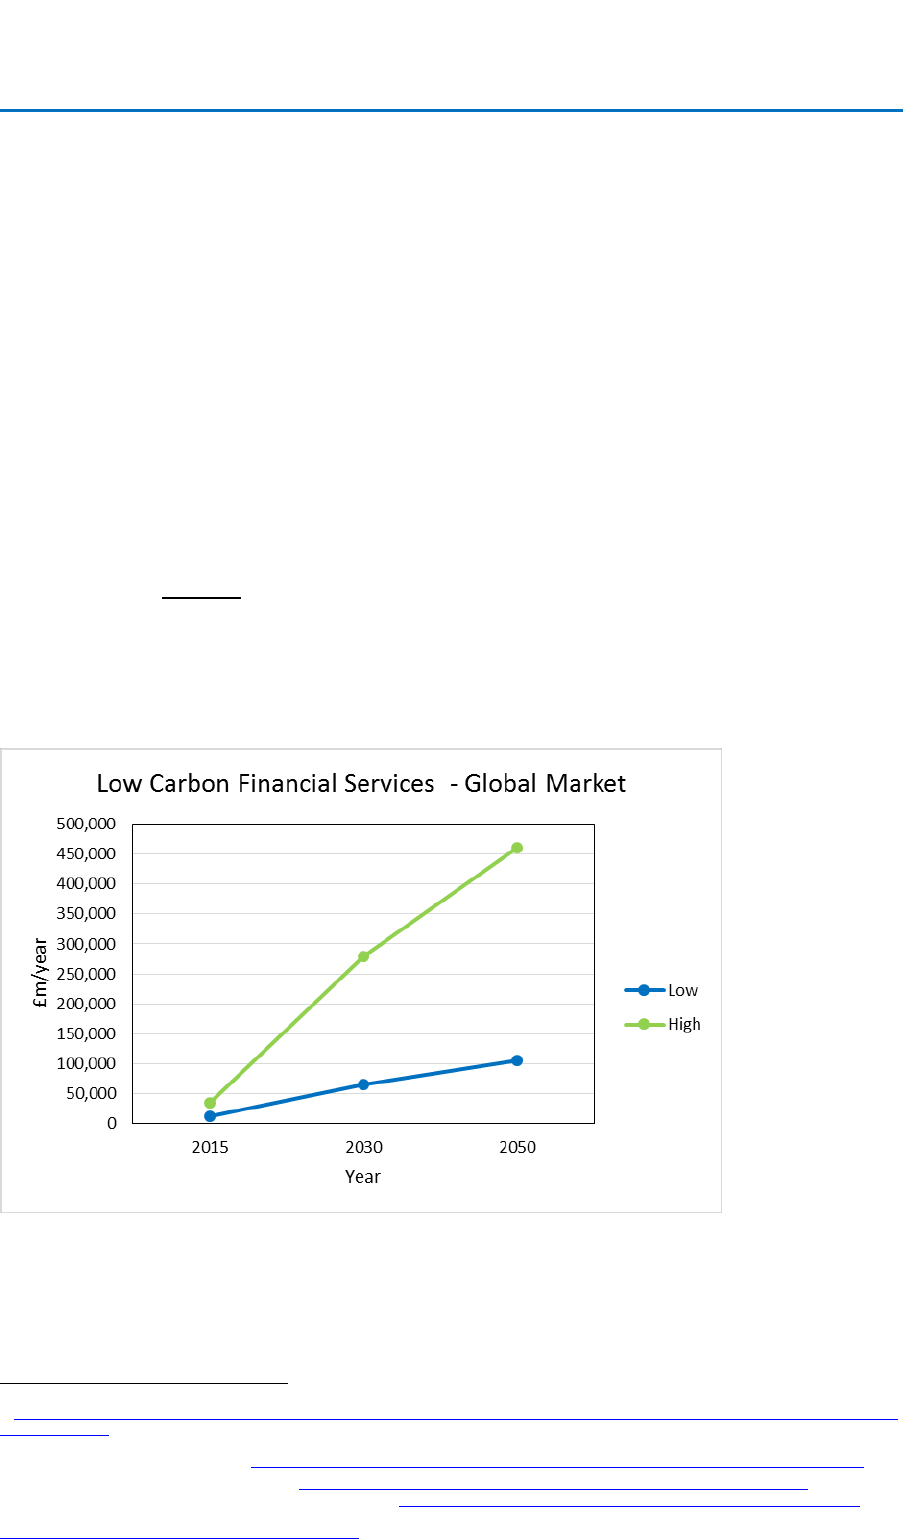
UK business opportunities of moving to a low carbon economy I 25
Ricardo Energy & Environment
Ricardo in Confidence
Ref: Ricardo/ED10039 V7
4.2.3 Low Carbon Financial Services
Our estimates of the potential global market size for two selected opportunities within the low carbon
services sector are given in Figure 9. These identified a potential global market size of between £66 bn
and £280 bn per year in 2030 and £110 bn and £460 bn per year in 2050, with a CAGR of 12 to 15%
between 2015 and 2030 and 2 to 3% between 2030 and 2050.
Our assessment of the potential future global market size for low carbon financial services is based on
the range of estimates of annual capital investment required to transform the global energy supply
system by 2050 and simultaneously meet emissions targets consistent with restricting the rise in
average global temperature to less than 2 degrees.
These estimates were collated in the 2016 Review by the City of London that examined the potential
for the UK to act as an international hub for green finance
50
and correspond to average annual low
carbon investments equivalent to between 1.4% and 6% of global GBP. This latter estimate is higher
than previous estimates for the global low carbon transition, which range up to 2.5% of global GDP
51
,
The assessment assumes that 5% of the capital raised is related to financial services
52
, and a further
0.4%
53
is spent on the financial services related to insuring the performance and lifetime of low carbon
technologies and energy savings and that typical premium rates are 1% to 3% of the initial investment
54
.
The assessments exclude financial and advisory services related to project and programme de-risking
consultancy, weather related performance risks, climate change risks and other risks, manufacturers’
and contractors’ warranties and home insurance products related to the deployment of low carbon
technologies. These additional services were not included in the assessment due to a lack of data, but
in some cases can increase the proportion of project costs spent on financial services to 15%.
Figure 9: Estimated global market size for low carbon financial services in 2015, 2030 and 2050
50
https://www.cityoflondon.gov.uk/business/economic-research-and-information/research-publications/Documents/research%202016/globalising-
green-finance.pdf
51
Finance: Supporting the transition to a global green economy, (Extract from: Towards a green economy, Pathways to Sustainable Development
and Poverty Eradication), UNEP, 2011, http://web.unep.org/greeneconomy/sites/unep.org.greeneconomy/files/field/image/15.0_finance.pdf
52
Cost of raising equity, OFGEM/CEPA, 2010, https://www.ofgem.gov.uk/publications-and-updates/cost-raising-equity-cepa-2010
53
Based on analysis of OECD Insurance Statistics, 2005-2012, https://stats.ukdataservice.ac.uk/metadata/OECD/Insurance/2113031e.pdf
54
Financial Risk Management Instruments for Renewable Energy Projects, UNEP, 2004,
http://www.unep.org/pdf/75_Risk_Management_Study.pdf

UK business opportunities of moving to a low carbon economy I 26
Ricardo Energy & Environment
Ricardo in Confidence
Ref: Ricardo/ED10039 V7
4.2.4 Other Low Carbon Products and Services
Our estimates of the potential global market size for six selected opportunities within other low carbon
products and services sectors are given in Figure 10. These identified a potential global market size of
between £1.1 tn and £1.6 tn per year in 2030 and £2.8 tn and £4.5 tn per year in 2050, with a CAGR of
6 to 8% can be expected between 2015 and 2030 and 5% between 2030 and 2050. Biofuels,
bioprocessing, catalysts and membranes are approximately 70% of the global market for this group of
products and reflect the transition to lower energy / low carbon industrial processes.
Our assessment of the potential future global market size for other low carbon products and services
was based on the assessment of the potential market for selected products and services, including:
Advanced insulation of buildings
Alternative batteries (for electric vehicles)
Alternative magnets (for the motors in electric vehicles)
Biofuels
Industrial bioprocessing
Industrial catalysts
Membranes for separation processes
Recycling of Lithium batteries (from electric vehicles)
Smart grids (including smart meters, home automation, demand response, grid management,
control and automation and high voltage transmission reinforcement)
We excluded products related to electric vehicles from our analysis of the market size of other low
carbon products and services, since the costs of these are already included within the estimates for low
emission vehicles. This reduced the annual market size by 15% in 2030 and 20% in 2050.
A range of sources of market data was used to build estimates for growth in the markets for these
technologies from 2015 to 2030 and 2050. These included the IEA roadmap for sustainable buildings,
market forecasts by consultants and market analysts, and estimates of EV sales described in section
4.2.2.
Figure 10: Estimated global market size for other products and services considered in 2015, 2030 and 2050

UK business opportunities of moving to a low carbon economy I 27
Ricardo Energy & Environment
Ricardo in Confidence
Ref: Ricardo/ED10039 V7
Box 1: Market opportunities associated with the Circular Economy
“A circular economy is one that keeps products, components and materials at their highest use and value at all
times. It is an alternative to the current linear economy, where we make, use and then dispose of products,
components and materials. A circular economy can stimulate innovation in areas like product design, re-use and
remanufacturing facilities, business models as well as new forms of finance.”
(Towards a circular economy – context and opportunities, London Waste & recycling Board, 2015 )
The literature did not provide sufficient detailed information on global impact on the circular economy
to enable the overall size of the market opportunity in 2030 and 2050 to be quantified. There are
some partial estimates for current markets, for example CLEPA (the European Association of
Automotive Suppliers) puts the vehicle remanufacturing market in Europe at US$ 10 to 12 billion.
There are many estimates of the benefits of the circular economy, but not of the market value. For
example, a report on the potential benefits of a circular economy in London estimates that:
Circular economy opportunities in the build environment will add £3-5bn to GDP by 2036
The annual circular economy with savings in the textiles sector of over £1bn by 2036
The annual circular economy savings in the plastics sector will be at least £200m by 2036
The circular economy opportunities in the food sector will add £2-4bn to GDP by 2036
The circular economy savings in the electrical and electronic equipment will be at least
£900m by 2036
The circular economy represents a radical shift in perspective—as it involves redesigning products
to increase product lifetime and end of life component reuse, new business models based on shared
use rather than individual ownership, and changes in consumer behaviour to eliminate waste. The
disruptive nature of its approach means that it will have a major impact on all sectors of the economy.
4.3 Size of the LCE opportunity for UK business
Our estimates of the size of the opportunity for UK business to provide the products and services that
will be needed during the global transition to low carbon economy are based on:
An estimate of the size of the UK market in 2015, 2030 and 2050
An estimate of the share of the global market that UK will capture, assuming that export
performance is as currently for relevant sectors – as illustrated in Figure 5 in Section 3.2.
Current export performance for sector groups that relate to low carbon products and services gives
a starting point for estimating the size of the UK opportunity from global transition to a low carbon
economy.
Section 5 considers possibilities to increase UK market share in areas of strength
In this analysis, the size of the UK market is a major factor in assessing the potential turnover that UK
companies could realise, since exports only represented around 25% of turnover across the 8 sector
groupings supplying the products and services considered by our market assessments (see Table 11

UK business opportunities of moving to a low carbon economy I 28
Ricardo Energy & Environment
Ricardo in Confidence
Ref: Ricardo/ED10039 V7
Table 11: Current levels of global imports/exports, UK exports and UK share of global export market
55
Sector Grouping
56
% Global Output
imported/exported
UK % of Global
export market
% UK Output
Exported
Chemicals / Related Industries
26.3%
2.5%
43.8%
Computer and information
services
9.9%
6.2%
12.6%
Metals / Metal Products
19.4%
2.7%
40.7%
Machinery / Electrical Products
37.1%
1.8%
48.1%
Transport Equipment
31.3%
4.5%
62.6%
Construction
0.9%
2.1%
0.5%
Financial services
8.0%
19.9%
30.7%
Insurance
8.5%
14.1%
14.9%
Total (8 sectors)
18.7%
3.7%
24.3%
55
Based on analysis of World Input Output Tables 2010 to 2014, World Input-Output Database http://www.wiod.org/home (November 2016)
56
These sector groupings are as used in World Input Output Tables (see previous footnote). Each of the low carbon sectors considered in the
current work was associated with a sector grouping that was considered to give the best fit. Figures from Table 6 were then used in analysis of
the UK share of the global market. The association of sector groupings with the low carbon products and services considered is given in Appendix
2 and in sub-sections 4.3.1 to 4.3.4.

UK business opportunities of moving to a low carbon economy I 29
Ricardo Energy & Environment
Ricardo in Confidence
Ref: Ricardo/ED10039 V7
4.3.1 Low Carbon Electricity
Estimates of the opportunity for UK business for the low carbon electricity sector are given in Figure 11.
These identified a potential global market size of £11 bn per year in 2030 and £18 bn and £19 bn per
year in 2050, with a CAGR of 9% can be expected between 2015 and 2030 and 3% between 2030 and
2050.
The assessment of potential UK share of the global market for low carbon electricity related products
and services, is based on obtaining the same percentage of the global export market as is currently
obtained in sectors supplying machinery and electrical products, and related services, and on estimates
of the annual capital investment needed to achieve the decarbonisation of the UK electricity generation
sector by 2050 as envisaged under the scenarios used by CCC in developing the 5
th
Carbon Budget.
For consistency with the assessments of global market size outlined in Section 4.2.1, the UK
assessments used the same estimates of capital cost per GW and an allowance for end-of-life
replacement (normally after 20 years). They also did not include the costs of Operation and
Maintenance (O&M).
Figure 11: Estimated UK share of global market for selected low carbon electricity sectors in 2015, 2030
and 2050
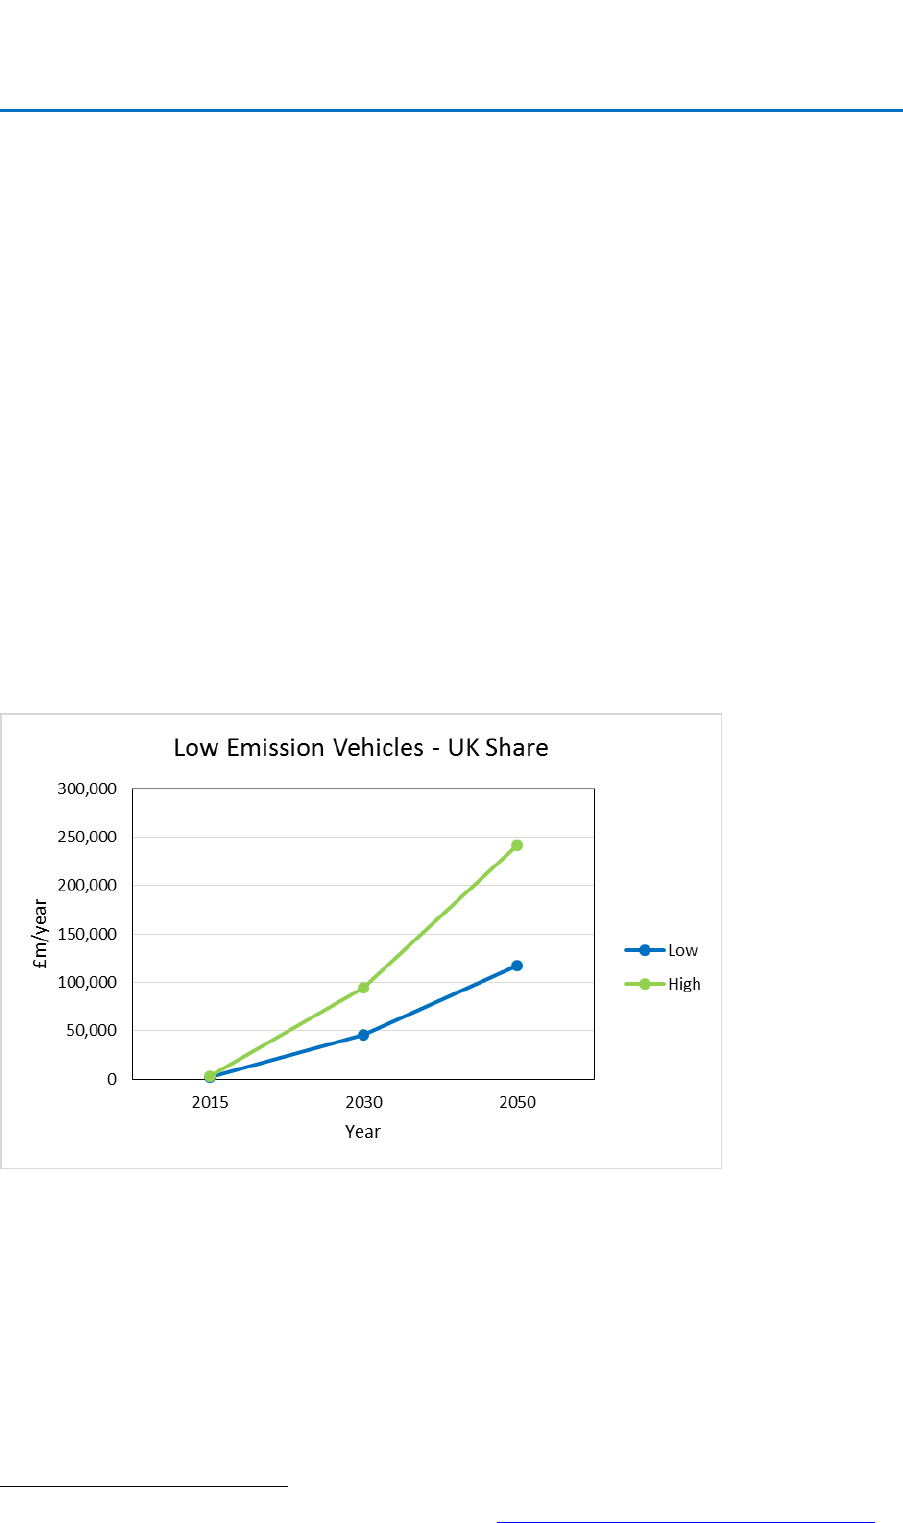
UK business opportunities of moving to a low carbon economy I 30
Ricardo Energy & Environment
Ricardo in Confidence
Ref: Ricardo/ED10039 V7
4.3.2 Low Emissions Vehicles
Estimates of the opportunity for UK business for selected products and services relating to low emission
vehicles are given in Figure 12. These identified a potential global market size of between £46 bn and
£95 bn per year in 2030 and £120 bn and £240 bn per year in 2050, with a CAGR of 22 to 26% can be
expected between 2015 and 2030 and 5% between 2030 and 2050.
The assessment of potential UK share of the global market for products and services related to low
emission vehicles is based on obtaining the same percentage of the global export market as is currently
obtained in sectors supplying transport equipment and related services. It is also based on estimates
of the annual capital investment needed to increase the share of Electric Vehicles sold to 60% of annual
sales of light duty vehicles by 2030, and 100% by 2050 as envisaged under the scenarios used by CCC
in developing the 5
th
Carbon Budget, with high and low estimates depending on the proportion of FCEV
sold.
For consistency with the assessments of global market size outlined in Section Error! Reference
source not found., the UK assessments used the same estimates of initial purchase costs of electric
vehicles. They also do not include Operation and Maintenance (O&M) costs or the costs of medium and
heavy duty electric vehicles.
It is assumed that the UK market for logistics and telematics evolves at the same rate as the global
market, and that the UK market is in proportion to its share of the global market for light duty vehicles.
It is also assumed that annual sales of UK light duty vehicles remain at 2015 levels in line with recent
trends in vehicle registrations
57
, whereas global sales increase by over 200% between 2015 and 2050
58
.
Figure 12: Estimated UK share of global market for selected low emission vehicles in 2015, 2030 and 2050
57
Table VEH0252, Department for Transport, 2015, Vehicle Licensing Statistics https://www.gov.uk/government/collections/vehicles-statistics
58
Figure 2, IEA Technology Roadmap: Electric and plug-in hybrid electric vehicles, 2011.

UK business opportunities of moving to a low carbon economy I 31
Ricardo Energy & Environment
Ricardo in Confidence
Ref: Ricardo/ED10039 V7
4.3.3 Low carbon financial services
Estimates of the opportunity for UK business for selected opportunities assessed in the financial
services sector are given in Figure 13Error! Reference source not found.. These identified a potential
global market size of between £1.7 bn and £7.5 bn per year in 2030 and £4 bn and £17 bn per year in
2050, with a CAGR of 12 to 15% can be expected between 2015 and 2030 and 4 % between 2030 and
2050.
The assessment of potential UK share of the global market for low carbon financial services, is based
on obtaining the same percentage of the global export market as is currently obtained in sectors
supplying financial and insurance services. It is also based on a UK home market that proportional to
the ratio of UK electricity demand to global electricity demand, which is expect to remain around 1.3%.to
2050. This method of allocation results in an average annual investment of between 0.5% and 2% of
UK GBP, which is in line with the estimated cost of the UK low carbon transition in the Stern Review
59
.
As outlined in section 4.2.3, the assessment only covers the financial services related to raising the
capital needed to invest in low carbon technology projects and excludes the capital sums raised.
Figure 13: Estimated UK share of global market for low carbon finance services in 2015, 2030 and 2050
59
http://webarchive.nationalarchives.gov.uk/20100407011151/http://www.hm-treasury.gov.uk/sternreview_index.htm
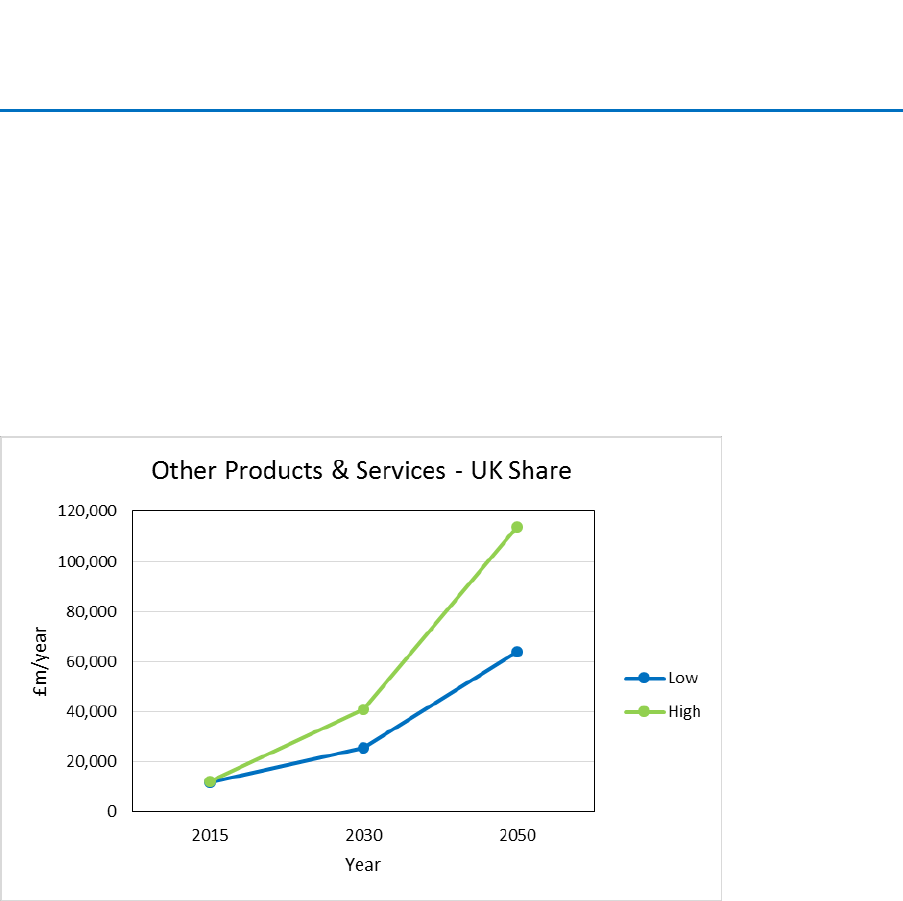
UK business opportunities of moving to a low carbon economy I 32
Ricardo Energy & Environment
Ricardo in Confidence
Ref: Ricardo/ED10039 V7
4.3.4 Oher Low Carbon Products and Services
Estimates of the opportunity for UK business for selected other products and services are given in
Figure 14These identified a potential global market size of between £26 bn and £41 bn per year in 2030
and £64 bn and £110 bn per year in 2050, with a CAGR of 5 to 8% can be expected between 2015 and
2030 and 5% between 2030 and 2050.
The assessment of potential UK share of the global market for selected other low carbon products and
services is based on obtaining the same percentage of the global export market as is currently obtained
in sectors supplying similar products and using the ratio of UK GDP to global GDP in 2015 to estimate
the size of the UK home market. The potential UK market share is the sum of the resulting values.
Figure 14: Estimated UK share of global market for other products and services in 2015, 2030 and 2050

UK business opportunities of moving to a low carbon economy I 33
Ricardo Energy & Environment
Ricardo in Confidence
Ref: Ricardo/ED10039 V7
4.4 Projection of overall future market opportunities
Projected UK turnover arising from transition to a low carbon economy grows from £43bn to 126bn
in 2015 to £210bn to £600bn by 2030 and £0.5tn to £1.4tn by 2050.
Projected UK employment arising from transition to a low carbon economy grows from 0.2m to 0.4m
in 2015 to 1.0m to 2.2m by 2030 and 2.5m to 5.0 by 2050.
To estimate the overall size of the UK low carbon market in 2030 and 2050, we applied the estimates
of CAGR derived in section 4.3 to the estimates of the current UK market size produced by ONS and
TBR, which were rebased to 2017 prices and used to generate low and high estimates. The results of
this analysis are shown in Table 12, which indicate an overall market growth of around 11% pa between
2015 and 2030, and 4% between 2030 and 2050. The method assumes that the products and services
assessed in this project are broadly representative of all segments of the market.
Table 12: Projected UK turnover related to the low carbon economy (£2017 Prices)
Low carbon economy
(LCE) sector
60
2015 Turnover (£bn)
2030 Turnover (£bn)
2050 Turnover (£bn)
Low
High
Low
High
Low
High
Energy efficient products
20.4
17.5
55.7
47.7
146.4
125.4
Energy from waste and
biomass
4.6
27.1
12.4
73.9
32.6
194.3
Low carbon electricity
12.5
34.9
43.7
121.7
75.5
210.4
Low carbon heat
1.2
7.8
3.3
21.4
8.7
56.3
Low carbon services
0.7
4.1
4.5
27.0
10.4
62.5
Low emission vehicles,
infrastructure, fuels cells
and energy storage
3.9
9.9
94.1
237.0
240.1
604.6
Waste processing and
materials recovery
0.0
24.6
Not
included
67.1
Not
included
176.4
Total
43.3
125.9
213.6
595.3
513.9
1,429.7
To estimate the level of employment generated by UK low carbon market in 2030 and 2050, we applied
the estimates of CAGR derived in section 4.3 to the estimates of the current UK employment produced
by ONS and TBR, which were used to generate low and high estimates. The results of this analysis
are shown in Table 13 which indicate an overall growth in LCE market employment levels of around 11
between 2015 and 2030, and 4% between 2030 and 2050. The method assumes that the products
and services assessed in this project are broadly representative of all segments of the market. The
growth rates applied to each LCE sector are given in Appendix A4.4,
60
The sectors in this table have been used by the Office of National Statistics to present the size of the UK low carbon economy. As this report
relates to opportunities for the UK low carbon economy, these sectors will be used from this point onwards. A comparison of the sub-sectors
included by ONS and by the analyses in this report is in Appendix 2.

UK business opportunities of moving to a low carbon economy I 34
Ricardo Energy & Environment
Ricardo in Confidence
Ref: Ricardo/ED10039 V7
Table 13: Projected UK employment related to the low carbon economy
Low carbon economy
(LCE) sector
61
2015 Employment
(thousands)
2030 Employment
(thousands)
2050 Employment
(thousands)
Low
High
Low
High
Low
High
Energy efficient products
143
91
389
248
1,023
652
Energy from waste and
biomass
10
19
27
52
72
137
Low carbon electricity
47
161
164
562
283
971
Low carbon heat
4
42
10
115
25
301
Low carbon services
15
29
98
187
227
433
Low emission vehicles,
infrastructure, fuels cells
and energy storage
15
18
359
440
916
1,123
Waste processing and
materials recovery
0
89
0
584
0
1,353
Total
233
449
1,046
2,187
2,546
4,970
4.5 Opportunities for UK firms to capture a greater share of
future global markets
The estimates of potential UK share of global markets presented in this section are based on the UK’s
current share of global exports, and hence on the UK’s current strengths in manufacturing and services.
There is potential to increase this share by building on UK strengths in research and innovation (see
Section 3), and by addressing barriers to market entry and to increasing market share (see Section 5).
Comparing our results with previous analysis of the LCEGS market in 2011/12
62
, our model forecasts:
A lower ratio of UK to Global Market Size (2.5% compared with 3.7%)
A higher proportion of UK turnover that is exported (21.7% compared with 9.5%)
These differences suggest that the UK LCE market is not yet focused on the export market and that
there is scope to grow UK exports as the UK invests in the transition to a low carbon economy
63
..
61
The sectors in this table have been used by the Office of National Statistics to present the size of the UK low carbon economy. As this report
relates to opportunities for the UK low carbon economy, these sectors will be used from this point onwards. A comparison of the sub-sectors
included by ONS and by the analyses in this report is in Appendix 2.
62
https://www.gov.uk/government/uploads/system/uploads/attachment_data/file/224068/bis-13-p143-low-carbon-and-environmental-goods-and-
services-report-2011-12.pdf
63
The modelling approach probably over estimates the potential for exports, and could be refined by splitting project costs down into the costs of
construction, manufactured goods and services and modelling the proportion of turnover exported on each cost element separately.

UK business opportunities of moving to a low carbon economy I 35
Ricardo Energy & Environment
Ricardo in Confidence
Ref: Ricardo/ED10039 V7
5 Stakeholder views on opportunities, barriers and
potential actions
5.1 Introduction
To provide additional views on the business opportunities of moving to a low carbon economy, 19
interviews were conducted with a total of 23 stakeholders. The stakeholders were from the business,
and academic communities as well as from trade associations and devolved administrations. The
stakeholders were chosen as being involved in the range of areas addressed in this report. It was not
attempted to seek views on every individual technology considered, and the summary of views below
should be considered in that light. The views summarised below are as expressed and have not been
assessed. They are those of the stakeholders interviewed and do not represent the views of Ricardo
Energy & Environment or of the CCC.
The interviews were structured around a number of key areas. After initial feedback on areas of
expertise and of collaboration, views were sought on: opportunities for the UK arising from the transition
to the low carbon economy – in the area of interest of the interviewee; barriers to exploiting R&D and/or
developing these new market opportunities, both in the UK and globally; actions that the interviewee
considered the UK Government could take to increase the UK share of the global market in the area of
interest; and any other issues.
The stakeholder views are summarised below using the headings for opportunities used in this report.
For each group views are summarised on the opportunities, barriers and potential actions to increase
market share.
5.2 Low carbon electricity
5.2.1 Opportunities
The UK has a world class oil and gas industry, which is well placed to be active in Carbon Capture and
Storage (CCS). UK companies within the existing oil and gas industry supply chains would be well
placed to capture value from new CCS plants. The market for solar in the UK remains significant and
supply chain opportunities in relation to renewable energy are also possible. For example,
manufacturers close to the deployment location of technologies could capture value where their location
makes them more competitive, for example turbine tower manufacturers in Scotland may be able to be
more competitive due to reduced transport costs. The service sector also offers opportunities for long
term jobs e.g. service technicians in localities close to installations.
The UK has strong research and is leading the way in some areas, for example in terms of integrating
renewables into the electricity network and smart grids. There is expertise in this area that could be
exported as other countries diversify their energy mix.
5.2.2 Barriers
There is uncertainty over CCS, with no Government incentives or clear business case at present. Higher
renewable energy penetration could mean a reduced role for CCS, and high capital expenditure means
investors would need to be confident in available opportunities.
The unbundled nature of the UK market helps promote competition and drive changes. However there
also needs to be clear policy to support this. Overall policy aims to provide low carbon electricity, reduce
imports, and lower costs for consumers. However, the lack of clear policy in some technology areas,
that could contribute to these overall aims, poses a barrier to the route to market. This, in turn, deters
investors. For example, there is a need for a long term policy direction on specific renewables sources,
such as on-shore wind, if stable markets and revenues are to be developed. Other renewables have
also been adversely affected by policy decisions, for example the Climate Change Levy on solar. Policy
uncertainty in other countries, for example following the recent US election, could also provide an
adverse signal to investors.
5.2.3 Actions that could be taken to increase share of global market
A vibrant UK market would help to enhance export potential and this could be encouraged by
Government providing a clear route to market, through policy. Current funding steams such as through

UK business opportunities of moving to a low carbon economy I 36
Ricardo Energy & Environment
Ricardo in Confidence
Ref: Ricardo/ED10039 V7
Innovate UK and the Energy Catayst were commended. Action to address barriers will also assist the
UK market – examples of barriers cited include grid connection issues for renewable electricity and
access to funding for the whole supply chain. Addressing these would help commercialisation and
enable the scaling up of technologies for those ready to focus on delivery and roll out.
A proactive approach is needed to address various issues such as subsidy restrictions and planning
barriers. For example, technologies may have developed significantly in recent years since planning
consents were awarded. This may mean that latest technologies cannot be deployed due to restrictions
on heights, blade sizes etc. which have changed as technology has developed.
5.2.4 Other issues around capturing new market opportunities
Investment in smart grids will help increase connectivity of renewables to the grid as consumers start
to think more about where their energy comes from and when to buy it.
The unbundled market in the UK makes it easier for new entrants to get a foothold in the market,
however as energy markets develop and non-traditional models are used there is a concern from some
that those involved in these alternative models may not have the same level of regulation as traditional
suppliers to ensure all are providing value and acting in the interests of the energy system as a whole
and the end customers.
Devolved administration views
Opportunities
Opportunities exist to develop the industry e.g. for renewables and nuclear (in one devolved
administration area) close to the deployment of such solutions. This includes the development of the
right capabilities, technical expertise and knowledge. The alternative is that this will be brought in
from overseas, limiting local benefits.
There is an opportunity to demonstrate innovation projects that will benefit the local energy market
through grant funding. A scheme in Scotland currently includes 18 capital grant projects and data on
economic impacts of accelerating low carbon infrastructure should be available in the next 12-8
months.
Significant opportunities also exist through devolved administration support for energy efficiency,
further opportunities will be developed in future through actions identified in the Scottish
Government’s draft Climate Change Plan, such as through considering how the Energy Savings
Opportunity Scheme can be used as a tool beyond compliance, how low carbon technology
demonstrators can be encouraged and how to incentivise additional heat recovery opportunities
within businesses. The Scottish Government is currently consulting on its draft Energy Strategy,
Local Heat & Energy Efficiency Strategies and Regulation of District Heating as well as the Scottish
Energy Efficiency Programme.
Specific opportunities exist in Scotland to consider carbon capture and storage linked to North Sea
oil and gas infrastructure, whilst the Scottish electricity sector is already looking at distribution
networks to provide flexible approaches to active network management and storage. There is a
potential to build on this and export knowledge and skills to the wider UK and to Europe. Smart grid
technology is likely to be a growth sector given the moves towards active network management at
transmission and distribution levels and more local balancing. Specific opportunities also exist in
Scotland to maximise the use of renewable electricity generation through the production of hydrogen
by electrolysis for entry into future hydrogen markets in a low carbon economy. This hydrogen
production method is currently operating in Scotland in Fife and Aberdeen and will come on line soon
in the Orkney Islands.
Barriers
The main issue is clarity on what UK Government wants. Is it cheap technologies close to market
that will address energy issues, is it solutions which allow UK companies to enter new geographical
markets with new products i.e. supply of green hydrogen internationally, or is it the regeneration of
skills and capability in particular areas and the development of an industry? It is acknowledged that
in some cases the starting base may be low and therefore a realistic view on the value captured
locally initially needs to be taken. For some solutions e.g. tidal stream/lagoons, UK Government
strategy does not provide a clear steer.

UK business opportunities of moving to a low carbon economy I 37
Ricardo Energy & Environment
Ricardo in Confidence
Ref: Ricardo/ED10039 V7
There are also a number of barriers to the development of emerging technologies. Research on the
practical application of hydrogen gas as a low-carbon substitute for methane within the current gas
grid is required. The transfer of emerging technologies from the academic stage to a commercial
stage can be difficult. And emerging technologies need help to find a route to market and to help to
de-risk demonstration projects – this may need a wider discussion at UK level. Local innovation
technology companies can be over-ambitious and need to consider the use of smaller scale
demonstrations in building confidence. Fostering collaboration, due to commercial sensitivities can
also be difficult.
A specific issue in Scotland is that the decommissioning of North Sea infrastructure may limit
opportunities for demonstration and development of carbon capture and storage (CCS). There is a
timeline for decommissioning and a need to consider alignment of this with opportunities for CCS.
The symbiotic relationship between a large scale hydrogen network of the future and CCS also needs
to be better understood.
Actions that could be taken to increase share of global market
There needs to be clarity in terms of direction from UK Government and then appropriate support
mechanisms in line with long term requirements. These could be, for instance, development of
industry and of appropriate skills and capabilities. A clear stable long term policy direction will also
attract long term investment and boost indigenous capabilities and supply chain evolution.
Government can also help facilitate collaboration in local clusters by providing an independent
partner, helping to facilitate knowledge sharing, and providing long term perspectives.
5.3 Low emission vehicles
5.3.1 Opportunities
The UK has opportunities in the electric vehicle battery manufacturing sector, which will be significant
as the market for such vehicles increases. There is also a very good academic base related to this,
which should be maintained. The right investments now by the UK in vehicle battery manufacturing
would set up the industry and manufacturers well for future opportunities in storage in the electricity
network and enhance their ability to enter the grid market.
Historically the UK has strengths in manufacturing and designing internal combustion engines (ICE).
Ultimately this will need to be replaced, but current research and development opportunities exist within
the ICE sector as well as for advanced fuels and electric vehicles. The UK would also be well placed
for research and development in areas such as electric machines and power electronics. However
actual manufacturing may be more likely in lower costs economies.
Other opportunities were identified in areas such as: charging software; new logistics approaches, such
as disruptive logistics, together with the necessary data collection requirements to put this into practice;
and inductive (wireless) charging.
5.3.2 Barriers
Within the UK, research and development support is good. However barriers exist in the scaling up of
technologies, including; investment gaps; sufficient expertise to exploit research; a conservative culture
as opposed to taking risks and accepting some may be failures; and a lack of UK manufacture
leadership.
Investment is hard to attract due to high infrastructure requirements and long return periods – investors
are usually focused on short payback with limited investment horizons. Political uncertainty and
potential policy changes also provide investment uncertainty. Therefore, help to set up manufacturing
and incentivise exports through integrated support covering aspects such as infrastructure, land,
financial and technical skills may be required.
The lack of a strategic overview of freight transport is a barrier to addressing this important carbon
emitter. The lack of data related to how full and heavy freight is also contributes to this.

UK business opportunities of moving to a low carbon economy I 38
Ricardo Energy & Environment
Ricardo in Confidence
Ref: Ricardo/ED10039 V7
5.3.3 Actions that could be taken to increase share of global market
Continuing Government support and a long term policy direction is required. Areas of support needed
include infrastructure, e.g. charger installations, finance and investment, support to SMEs to help them
compete with global leaders, and development of good international standards to ensure the UK is not
disadvantaged on the global stage.
Strategic policy is required for freight transport, including appropriate approaches on data collection by
industry to enable new approaches to be utilised.
5.4 Energy efficient products
5.4.1 Opportunities
It was highlighted there could be benefits from closer links between material manufacturers and end
users to understand how materials are used and incorporated in products and components and make
improvements and efficiency savings. As an example, a Magnet Manufacturing Hub was suggested. A
similar approach has been used in Japan to link materials through to end user applications. In the UK
a water partnership
64
has been set up to come up with ways to improve marketing overseas to improve
UK goods sales levels.
There is significant opportunity at the micro and small medium enterprise business level. Such
businesses have the opportunity to develop into larger entities. However unless the development of
domestic markets can be supported, from which export markets can potentially be developed, there is
the risk that companies will look to move abroad to demonstrate and deploy their products.
5.4.2 Barriers
Funding is a major concern following Brexit, especially as significant amounts currently come from
European sources for some areas of research and development. European projects enable UK
expertise to participate in large integrated projects, providing links across Europe and partnerships to
access wider expertise and knowledge and in some cases feedstock for recovery of materials.
The participation of UK academics and industry in European projects also helps to ensure UK interests
and issues are represented and taken into account as part of the wider agenda. Following Brexit there
is the risk that UK specific aspects may not be considered as fully and the UK will need to consider
these itself, which will have funding implications.
Regulation and processes can favour larger entities and not necessarily SMEs. For example regulations
and terms and conditions aimed at larger companies in relation to public procurement could be
overcome by changes in the domestic market.
Political barriers mean that there is not always the will or prioritisation to help develop and promote
areas where the UK has strength, such as developing high tech solutions with export opportunities.
Other countries, such as China are moving forward themselves and could leave the UK behind with
opportunities missed.
5.4.3 Actions that could be taken to increase share of global market
Government could support new hubs and partnerships to drive efficiencies through material
manufacturers and end user applications having a better understanding of each other’s needs. There
could also be re-engagement on critical materials and security of supply, particularly from a UK specific
perspective given current work is predominately EU led.
A strategic view of funding across larger integrated projects is required to ensure UK involvement, as
well as greater prioritisation of technology developments and incentivising uptake. Regulations and
procurement guidelines can also be reviewed and revised accordingly to ensure public procurement
markets are readily accessible to all sizes of companies.
5.4.4 Other issues around capturing new market opportunities
There is a need for whole systems planning, it is not just about the product and solution level inputs but
also the supporting infrastructure and outputs it leads to. Examples might be in the areas of smart
infrastructure and electric vehicles where it is important to consider and develop the infrastructure
64
See https://theukwaterpartnership.org/

UK business opportunities of moving to a low carbon economy I 39
Ricardo Energy & Environment
Ricardo in Confidence
Ref: Ricardo/ED10039 V7
required as well as developing the core technologies. This overall perspective will enable Government
to capture opportunities as they arise. This requires agility in reacting to the market and promoting
innovation.
5.5 Other sectors
5.5.1 Opportunities
Opportunities exist in the UKs food waste processing to capture food and green waste currently sent
to landfill, reducing emissions such as methane, and providing a useable output to use on land as
fertiliser as an alternative to artificial fertilisers. This includes the growing media sector, who are using
compost to replace all or some of the peat in their products.
The biofuels sector also provides UK opportunities if barriers can be overcome both in terms of using
first generation biofuels and developments with second generation biofuels, such as waste feedstocks.
The UK could have technology and skills advantages in this area, providing real benefits, through the
research and development UK companies are doing.
Finance and professional service opportunities are promoted within the UK. For example the City of
London’s Green Finance Initiative aims to promote London and the UK as a leading global centre for
the provision of green financial and professional services
65
, in addition to other initiatives such as the
Green Investment Bank. The opportunities include raising finance but also the support needed
alongside this such as advice on technical, legal, international obligations and secondary market
matters.
5.5.2 Barriers
A key barrier for food waste processing is that collection in England is not mandated, and financial
pressures mean that, while local authorities are keen to collect food waste, it may not always be done.
Investment in the infrastructure for treating food waste requires assurances over feedstock availability,
while cut backs in incentive schemes mean that the viability of smaller plants has reduced.
For Biofuels there is the potential for too much wishful thinking. There needs to be a realistic view on
what can be achieved. Inconsistent policy and support for areas that are required but are perhaps not
the main focus needs to be addressed to provide stability and investor confidence. Political barriers,
feedstock availability and a local willingness to use biofuels are also issues.
In terms of finance, barriers relate to the cost of electricity produced by different sources, for example
how is low carbon electricity, that is cheaper than electricity from fossil fuels, delivered? This is linked
to aspects such as storage, the integration of renewable energy into local grids and the use of smart
grids to better balance the supply of and demand for electricity. The price of carbon also needs to be
considered. It could be beneficial for the level of a carbon tax to be agreed globally – this could reflect
the real cost of 1 tonne of carbon emitted into the atmosphere and hence the cost of avoiding this.
5.5.3 Actions that could be taken to increase share of global market
For food waste processing, Government could mandate the collection of food waste in England. There
could also be more done in terms of diverting more food that is still fit for human consumption through
its collection and redistribution to those who need food through schemes such as Fairshare.
Government could provide consistent support on biofuels, and stick with decisions the closer biofuels
get to reaching market in order to provide stability. Work could also be done to remove political barriers,
for example on the food vs. fuel debate, with appropriate messaging for the public and decision making
based on the problem and available solutions, rather than allowing politics to deflect decisions.
While the UK is leading the way in terms of the Climate Change Act, this may be an expensive way of
addressing emissions – are there smarter ways of financing or investing in ways to reduce greenhouse
gas emissions, perhaps at an integrated global level. Alongside carbon savings, the benefits of
investments in secondary markets, such as developmental prosperity and improvements in people’s
lives are also important factors.
65
http://greenfinanceinitiative.org/about/who-we-are/

UK business opportunities of moving to a low carbon economy I 40
Ricardo Energy & Environment
Ricardo in Confidence
Ref: Ricardo/ED10039 V7
5.5.4 Other issues around capturing new market opportunities
Further opportunities exist with the 'bio-based' economy area, where more can potentially be done with
natural materials e.g. algae for energy production, composite materials.
Stakeholder views – some themes
Some themes emerge from across the range of stakeholder interviews
The UK has a strong academic, industrial and business base in many areas that will grow
with transition to a low carbon economy
Current support for research and innovation is welcomed
A vibrant UK low carbon sector will provide a base for growing export market share
This growth will be enhanced by:
o Long term certainty, to the extent this can be achieved, in the policy and financial
context
o Continuing to consider means to enhance commercialisation of key technologies
needed for the low carbon transition
o A holistic approach considering infrastructure issues at the same time as
developing key technologies – for instance in considering developing of a charging
infrastructure at the same time as batteries and other aspects of electric vehicles
6 Conclusions on opportunities to increase the UK
share of future global markets
During this project, we have examined the potential role that various low carbon technologies could play
in reducing global emissions of Greenhouse Gases (GHG) and outlined a timeline for the transition to
a global low carbon economy that is consistent with limiting the rise in global temperature to below 2
o
C.
We have assessed the potential size of the global and UK markets for selected low carbon products
and services, and used these to estimate the potential for future growth in the UK low carbon economy
manufacturing and service sectors in the periods from 2015 to 2030 and from 2030 to 2050.
Our analysis suggests that the low carbon economy will grow from around 2% of UK Total Output in
2015 to up to around 8% by 2030, and around 13% by 2050
66
. The projected compound annual growth
rate for the low carbon economy is 11% per annum between 2015 to 2030, and 4% per annum between
2030 and 2050, which is substantially higher than the OECD’s projection of average UK GDP growth
of 2.3% per annum between 2015 and 2050
67
However realising this potential growth rate depends on maintaining and improving on the UK’s
competitive position in the global low carbon technology market, and investing in the development of
new products and services across a wide range of technologies and applications. In terms of immediate
priorities for investment, we have identified some high growth technologies that will be needed to deliver
the commitments made in the Paris Agreement, including:
Electric Vehicles
Transport telematics
Off-shore wind
Solar PV.
Smart Grids
Energy storage
66
Assuming that UK total output grows on average by 2.3% per year.
67
https://data.oecd.org/gdp/gdp-long-term-forecast.htm

UK business opportunities of moving to a low carbon economy I 41
Ricardo Energy & Environment
Ricardo in Confidence
Ref: Ricardo/ED10039 V7
Biofuels
We have also identified some technologies that will be need to be fully deployed by 2050:
Advanced materials and manufacturing, including design for reuse and waste recovery.
Low carbon chemical processes using bioprocessing, catalysts and membrane technology
In addition, there are significant opportunities for the UK services sector to establish itself as a financial
hub for green finance and gain a sizable share of the financial services associated with the estimated
capital investment of between $1.5 and $6 trillion per annum needed to deliver the global low carbon
economy.
Acknowledgements
Ricardo Energy & Environment would like to thank a number of organisations that participated in
interviews as part of this work including: ATP Controls, the Carbon Capture and Storage Association,
the Chartered Institution of Water and Environmental Management (CIWEM), Global Smart
Transformations, Heriot Watt University, Jaguar Land Rover, Oxford University, the Renewable Energy
Association, Scottish Government, the Solar Trade Association, University of Birmgham, University of
Warwick, Vestas, Welsh Government and Western Power Distribution.

UK business opportunities of moving to a low carbon economy
Ricardo Energy & Environment
Ricardo in Confidence
Ref: Ricardo/ED10039 V7
Appendices
Appendix 1: Methodology for estimating current market value for UK manufacturers of low carbon goods
and services
Appendix 2: Comparison of sectors and technologies considered
Appendix 3: Data sources and assumptions for estimating the size of future global markets associated
with the low carbon economy
Appendix 4: Summary data from current analysis

UK business opportunities of moving to a low carbon economy
Ricardo Energy & Environment
Ricardo in Confidence
Ref: Ricardo/ED10039 V7
Appendix 1 - Methodology for estimating current
market value for UK manufacturers of low carbon
goods and services
This method note is presented in two parts.
Part A describes the method used to develop up to date estimates of the low carbon economy, excluding
climate change adaptation. This method has been designed to allow CCC to generate further estimates
in the future.
Part B describes the method used to estimate the market value associated with climate change
adaptation, which has not been included in previous assessments of the low carbon economy.
Part A: Method used to estimate the current market value for UK
manufacturers of low carbon goods and services
This note sets out the key decisions taken and approaches adopted in:
Developing up to date estimates of the low carbon economy.
Preparing a method to allow CCC to generate further estimates in the future.
The aim of the project has been to provide estimates that are consistent with those prepared previously
and which would be recognised as being ‘of the correct order’ by experts operating within the low carbon
domain.
The philosophy underpinning the work has been to rely on data already in the public domain or which
are readily available from commercial sources.
The challenge in defining and quantifying the low carbon economy arises from the fact that its activities
and products are not well served by the current method of industrial classification, the Standard
Industrial Coding system. Thus alternative methods are required.
A1A.1 Definition
The work has focused on two main areas:
1. A generally accepted notion of the low carbon economy based on the creation of recognised
end products and services.
2. A group of activities and, often intermediary, products that are increasingly being considered
as being part of the move to a low carbon economy.
The generally accepted definition of the low carbon economy comprises:
• Renewable electricity generation
• Renewable heat
• Energy efficient products
• Alternative fuels
• Low emission vehicles
• Energy storage
• Low carbon services and finance
This has been the focus of activity aimed at generating up to date estimates of the low carbon economy.
In addition to this, efforts have been applied to acquiring quantitative data on:
• The circular economy
• Low carbon management
• Adapting to climate change
• Low carbon manufacturing
• Materials and product substitution

UK business opportunities of moving to a low carbon economy
Ricardo Energy & Environment
Ricardo in Confidence
Ref: Ricardo/ED10039 V7
As these areas are less well defined, dispersed and often incorporated into supply chains, access to
quantitative data has proven challenging.
A1A.2 Available estimates of the size of the low carbon economy
It was decided that efforts to generate a current estimate of the low carbon economy and to prepare a
model that would allow the CCC to produce its own figures in the future, could best be achieved by
focusing on prior work and published statistics.
A review of the literature identified:
1. The Low Carbon and Renewable Energy Economy survey undertake by ONS.
2. The Size and performance of the low carbon economy report, published by BIS/DECC in
2015 and prepared by TBR.
3. A range of sector based data published by trade associations and based on surveys of their
members.
4. Statistics prepared by Innovas/K-Matrix.
Each of the methods is considered below:
The ONS estimates are based on a survey sample of approximately 14,000 taken from across the UK
and includes all sectors, except those unlikely to be involved in the low carbon economy, e.g. public
administration, human health etc. were excluded. The sample was stratified by industry, employment
and UK country. The survey has run twice and data are available for 2014 and 2015 (preliminary
aggregated data only). There is some doubt regarding the future of the survey.
The BIS/DECC commissioned work utilises a different approach to the ONS survey. The method for
the BIS work is based around a database of 11,500 companies known to operate in the low carbon
economy based on a review of websites, membership of trade organisations or inclusion in schemes
such as the microgeneration certification scheme. A telephone survey was used to establish the extent
to which the businesses operated in each sector. The data published are for 2013. The database was
derived from IDBR and TBR’s own data on an approximately equal basis. TBR’s data are readily
available and can be used to provide estimates into the future.
A number of trade associations, e.g. Nuclear Industry Association (NIA) and RenewableUK (RUK)
undertake surveys of their members and publish these on a regular basis. The Renewable Energy
Association (REA) indicates that its estimates are provided by Innovas/K-Matrix. The Innovas/K-Matrix
data are derived using a proprietary model based on a range of input materials. The exact nature of
the model is not available.
A1A.3 Data methods and sources
A more detailed assessment of the three open methods is provided below. This seeks to offer the
strengths and weaknesses of each and its suitability for incorporation into a model for use by CCC.
ONS Low Carbon and Renewable Energy Economy
Since 2015, ONS has run a survey to establish the size of the low carbon economy. Whilst yet to be
classified as official statistics, they are provided by government, so are regarded as a de facto standard.
The survey covers the ‘generally accepted definition’ of the low carbon economy. The cost of the 2014
and 2015 surveys was borne by several government departments and the devolved administrations.
Funding for the survey into the future is unclear.
Strengths
Weaknesses
Governed by ONS rules – seen as reliable.
Governed by ONS rules – limits disclosure and
hence usefulness.
Provided by ONS – considered to be robust.
Not overly granular, some data suppressed.
This limits the usefulness of the data.
Used by government, so in general use and
‘numbers’ will be recognised.
Time lag between the survey and publication,
circa 18-24 months.
Method open and available for scrutiny.
Uncertainty over the future of the survey.

UK business opportunities of moving to a low carbon economy
Ricardo Energy & Environment
Ricardo in Confidence
Ref: Ricardo/ED10039 V7
As ‘near to’ official statistics, these data provide an ideal basis for any future estimates. In fact, if the
survey continues to be published there may not be a need for alternative estimates.
The initial results of the 2015 survey were published on 26/12/2016. However, this did not include
sector level data and only covered direct employment. The latter are scheduled for publication at the
end of Q1, 2017.
BIS Size and performance of the low carbon economy 2015 (TBR)
This work was commissioned by BIS/DECC/Defra and undertaken by TBR in advance of the ONS
survey being run. ONS sat on a peer review board and there are significant similarities in the sector
definitions used. The method used was published in the report published by BIS.
Strengths
Weaknesses
Scrutinised method – peer reviewed.
Limited survey sample (630) underpinning the
analysis.
Granular – not subject to ONS suppression rules.
Database requires updating.
Can be updated – to some extent.
Supported by a database of businesses, so an
audit trail is available.
The method used is significantly different to the ONS survey, so provides an alternative approach.
Updating is possible by importing up to date company data into the database
68
. Over time the database
will need to be refreshed to take account of new entrants into the sector and those which have ceased
operations in low carbon . This work will require access to similar sources to those used previously,
e.g. trade directories, certification schemes as well as financial data from IDBR, Companies House and
Dun & Bradstreet. A follow up survey to establish the extent to which firms operate across the various
low carbon sectors will also have to be undertaken.
Both the ONS and BIS approaches allowed for businesses to operate in multiple low carbon sectors.
However, the differences in approach could magnify any sampling errors.
Trade Associations – survey based only
Some of the trade associations undertake survey work to assess performance and change over time.
The surveys tend to focus on trade associations’ members, so coverage may be limited, and with some
activities receiving greater attention than others.
Strengths
Weaknesses
Sector specific.
Not all low carbon sectors covered.
Some sectors provide detailed data on location
(nuclear).
Some surveys cover members only.
Operated by sector specialists, so potentially
more insightful than those run by 3
rd
parties.
Issues over objectivity.
The trade association data may run the risk of ‘optimism bias’, so present potentially inflated results.
68
Up to date data are available for approximately half of the records. Costs will apply.

UK business opportunities of moving to a low carbon economy
Ricardo Energy & Environment
Ricardo in Confidence
Ref: Ricardo/ED10039 V7
A1A.4 Comparisons
The results of the comparative analysis are set out in the following table.
Clearly, some differences were to be expected. The principal causes of divergence include:
Lack of consistency within the definition of sectors.
Misalignment of sector groups, i.e. the sectors within the groups are not exactly the same.
The scope of the sectors in terms of how much of the supply chain is included in direct activity,
and where/how boundaries are drawn.
The methods used for assessing indirect employment.
The metrics used, e.g. employment count versus full time equivalents (FTE).
UK business opportunities of moving to a low carbon economy
Ricardo Energy & Environment
Ricardo in Confidence
Ref: Ricardo/ED10039 V7
ONS 2015 Sector
ONS Employment
(direct and indirect)
2014
Updated BIS 2015
employment
Commentary
Alternative fuels
*
*
Bioenergy
*
52,100
TBR sector is “Energy generation from waste and biomass”, “Biomass
equipment” and Alternative fuels”
Carbon capture and storage
*
4,200
ONS data appear to be suppressed.
Energy efficient lighting
31,000
14,600
The availability and prevalence of low energy lighting has increased since the
BIS work was published, so this may under report the sector. Defining the
boundary to include/exclude lighting types and installation is challenging.
Energy monitoring, saving or control systems
33,000
12,100
The BIS survey asked businesses to self identify as providers of products and
services. As many of these products are contained within larger products,
e.g. software, controls, componentry, inconsistency in definition is the most
likely cause of the differences. The BIS work sought to ‘pre-identify’
companies and hence may under report for this large and very diverse sector.
Fuels cells and energy storage
1,000
*
Included in low emission vehicles in BIS work.
Hydropower
2,500
7,300
This sector is characterised by large and small schemes. Many of the
smaller schemes operate as subsidiary activities, so may have been
excluded from the ONS survey based on SIC codes.
Low carbon financial and advisory services
20,000
28,600
A very diverse sector so differences were expected.
Low emission vehicles and infrastructure
25,000
18,400
The ONS definition expressly includes storage, so may have captured some
businesses not included in the BIS work.
Nuclear
37,500
60,400
The ONS survey excludes decommissioning and reprocessing of fuel, which
is included in the BIS data.
Offshore wind
11,500
13,000
The stated definitions were similar so the differences are likely to result from
sampling and alternative methods used.
Onshore wind
13,000
19,700
The stated definitions were similar so the differences are likely to result from
sampling and alternative methods used.
Other energy efficient products
216,500
144,300
As per energy monitoring, the diversity of the sector along with the methods
used are the likely causes of the discrepancies.
TBR/BIS analysis includes: energy-efficient doors and windows, insulation,
recycling – recovery and reprocessing of materials from waste; and
sustainable architecture.
Other renewable electricity
*
7,300
Geothermal and marine

UK business opportunities of moving to a low carbon economy
Ricardo Energy & Environment
Ricardo in Confidence
Ref: Ricardo/ED10039 V7
ONS 2015 Sector
ONS Employment
(direct and indirect)
2014
Updated BIS 2015
employment
Commentary
Renewable combined heat and power
3,500
*
Renewable heat
9,000
36,200
The stated definitions were similar so the differences are likely to result from
sampling and alternative methods used. TBR/BIS group includes: heat
networks, heat pumps, solar thermal and heat recovery and ventilation.
Solar photovoltaic
19,000
31,300
The stated definitions were similar so the differences are likely to result from
sampling and alternative methods used.
Total
447,500
449,400
Source: ONS and TBR/OrtusER
ONS have published initial figures for employment for 2015. These are only available for direct employment in groups of sectors and not yet for individual
sectors. Ortus have modelled the sector data to gain total (direct plus indirect) employment data for 2015, using the same multipliers applied by ONS for the
2014 numbers. This allows comparisons to be made between the ONS and BIS data for 2015. Differences are considered to be largely due to differences in
the definitions of the sector groups and in the methods used to determine employment numbers.
ONS Group
ONS Employment
(direct and indirect)
Updated BIS 2015
employment
2014
2015
Energy efficient products
280,500
257,000
202,000
Energy from waste and biomass
22,000
19,100
30,200
Low carbon electricity
86,000
99,800
139,400
Low carbon heat
12,500
6,500
30,800
Low carbon services
20,000
23,700
28,600
Low emission vehicles,
infrastructure, fuels cells and
energy storage
26,000
35,500
18,400
Total
447,500
441,600
449,400
Source: ONS and TBR/OrtusER

UK business opportunities of moving to a low carbon economy
Ricardo Energy & Environment
Ricardo in Confidence
Ref: Ricardo/ED10039 V7
Part B: Method used to estimate the current market value for UK
companies associated with climate change adaptation
A1B.1 Summary
Neither the BIS 2015 report, or the ONS Low Carbon and Renewable Energy Economy Survey included
the climate change adaptation sector. As such, we have devised a method to define and value the
adaptation sector.
As there were no existing estimates for the sector work had to be undertaken de novo, so the data must
be considered less robust than those presented above. The numbers were derived using a mix of key
words to identify firms operating in the sector along with coefficients to estimate the degree of
engagement of those firms known to operate the area, but not identified through the keywords.
Examples of the latter include the large engineering consultancies. The results are set out in the table
below.
The data are gauged to be of the correct order of magnitude when compared to government’s stated
spend of £170m in one year on flood defences and mitigation
69
.
Table A1B.Summary: Initial estimate of the UK adaptation sector, 2015
Group
Employment (n)
Turnover
(£000)
GVA (£000)
Building adaptation
520
96,700
30,200
Business mitigation and management
40
6,000
2,900
Climate event planning and response
570
69,300
19,600
Flood mitigation and management
3,140
252,600
85,900
Public realm adaptation
1,990
393,900
154,400
Engineering related scientific and technical
consulting activities
1,340
187,300
95,600
Other engineering activities
730
102,200
55,100
Other research and experimental
development on natural sciences and
engineering
1,530
235,600
78,700
Total
9,860
1,343,600
522,400
Source: TBR/OrtusER 2017
It should be noted that to some extent the adaptation sector will already be incorporated into the existing
low carbon economy. Thus the data set out in the table above cannot be simply added to the numbers
in Table 6 to Table 8 in the main text.
A1B.2 Defining the adaptation sector
The research team undertook desk research to collate the range of activities, technologies and systems
that form the adaptation sector. Through this process, a number of firms known to engaged in these
activities were also investigated.
This desk research identified five thematic groups within the adaptation sector, along with keywords to
describe the activities. These groups and keywords are:
69
Autumn Statement 2016.

UK business opportunities of moving to a low carbon economy
Ricardo Energy & Environment
Ricardo in Confidence
Ref: Ricardo/ED10039 V7
Table A1B.1: Keyword groups and sectors
Group
Keyword sectors
Building adaptation
Air Conditioning, Mechanical Ventilation, Ventilation Systems
Business mitigation and management
Business Continuity, Resilience, Risk Management
Climate event planning and response
Catastrophe, Disaster Management, Disaster Recovery,
Emergency Management, Emergency Planning, Emergency
Response, Reinsurance, Storm
Flood mitigation and management
Flood, Flood Barrier, Flood Defence, Flood Protection, Flood
Resilience, Flood Risk, Flooding
Public realm adaptation
Adaptation, Climate Change, Climate Risk, Coastal
Management, Extreme Heat, Green Infrastructure, Heat wave,
Heatwave, Reservoir Engineering, Sea Level, Solar Films,
Solar Shading, Sustainable Drainage, Thermal Management,
Urban Design, Water Engineering, Weather
Source: TBR 2017
A number of firms known to be active in the sector were not identified by keywords, as climate change
adaptation represents only a small proportion of their work. Thus additional steps needed to be taken
to include the impact of these businesses. This involved two steps; first of all, establishing suitable SIC
codes that would capture all these businesses, and secondly, estimating the proportion of their work
that could be deemed as being for the adaptation sector.
Establishing which SIC sectors to use was carried out by identifying the ones used by firms which were
known to be active in the adaptation sector.
These sectors were then included in the adaptation definition, as follows:
Table A1B.2: SIC sectors
SIC sector
Engineering related scientific and technical consulting activities
Other engineering activities
Other research & experimental development on natural sciences & engineering
A1B.3 Building the dataset
A total of 22,444 TCR records have been identified (following cleaning and checking):
1. 3,309 in the keyword sector data extract
2. Of which 2,748 are located in air conditioning and ventilation
3. 18,935 are in the ‘SIC based’ data extract (viz engineering related)
4. Of which 11,510 are located in Engineering related scientific and technical consulting
activities
5. Several hundred records were common in both data extracts. These were kept in the key
word dataset.
Due to the large number of firms appearing in the SIC-based search, coefficients have been applied to
estimate the extent of their activity that can be allocated to the adaptation sector. Three coefficients
70
were identified for each keyword sector and SiC sector..
70
The coefficients were based on judgement after reviewing websites and related data and comparisons with other activities. For example,
government planned to invest £170m in flood mitigation in the year following the Autumn Statement, 2016.

UK business opportunities of moving to a low carbon economy
Ricardo Energy & Environment
Ricardo in Confidence
Ref: Ricardo/ED10039 V7
Table A1B.3: Coefficients
Keyword sector
Low
coefficient
Medium
coefficient
High
coefficient
Risk Management
0.01
0.03
0.05
Reinsurance
0.01
0.03
0.05
Air Conditioning
0.02
0.05
0.07
Ventilation Systems
0.02
0.05
0.07
SIC sector
Engineering related scientific and technical consulting activities
0.02
0.05
0.07
Other engineering activities
0.02
0.05
0.07
Other research & experimental development on natural sciences &
engineering
0.02
0.05
0.07
Source: TBR 2017
A1B.4 Adaptation analysis
Employment, turnover and GVA have been calculated for each keyword sector and each SIC sector
using the coefficients.
The employment, turnover and GVA calculated for each keyword sector has been aggregated into the
relevant keyword group.
The three tables below present the data for scenarios based on the use of low, medium or high
coefficients:
Table A1B.4: Low coefficient scenario
Group
Employment (n)
Turnover (£000)
GVA (£000)
Building adaptation
522
96,691
30,245
Business mitigation and management
41
5,968
2,872
Climate event planning and response
568
69,262
19,626
Flood mitigation and management
3,136
252,576
85,947
Public realm adaptation
1,989
393,931
154,423
SIC Sector
Engineering related scientific and technical
consulting activities
1,341
187,273
95,640
Other engineering activities
732
102,175
55,056
Other research and experimental development
on natural sciences and engineering
1,531
235,607
78,669
Total
9,861
1,343,482
522,478
Source: TBR 2017

UK business opportunities of moving to a low carbon economy
Ricardo Energy & Environment
Ricardo in Confidence
Ref: Ricardo/ED10039 V7
Table A1B.5: Medium coefficient scenario
Group
Employment
(n)
Turnover (£000)
GVA (£000)
Building adaptation
1,304
241,604
75,574
Business mitigation and management
50
8,265
4,048
Climate event planning and response
593
94,591
27,013
Flood mitigation and management
3,136
252,576
85,947
Public realm adaptation
1,989
393,931
154,423
SIC Sector
Engineering related scientific and technical
consulting activities
3,353
468,184
239,101
Other engineering activities
1,831
255,437
137,640
Other research and experimental development on
natural sciences and engineering
3,828
589,017
196,673
Total
16,084
2,303,604
920,419
Source: TBR 2017
Table A1B.6: High coefficient scenario
Group
Employment
(n)
Turnover
(£000)
GVA (£000)
Building adaptation
1,826
338,213
105,794
Business mitigation and management
58
10,562
5,224
Climate event planning and response
619
119,920
34,400
Flood mitigation and management
3,136
252,576
85,947
Public realm adaptation
1,989
393,931
154,423
SIC Sector
Engineering related scientific and technical consulting
activities
4,694
655,457
334,742
Other engineering activities
2,563
357,612
192,696
Other research and experimental development on
natural sciences and engineering
5,359
824,623
275,342
Total
20,244
2,952,894
1,188,568
Source: TBR 2017
A1B.5 Overall LCE estimate
The medium coefficient scenario totals for the adaptation sector have been added to the previous
estimates for the overall low carbon and renewable energy economy. The results are shown below in
Table A1.7.

UK business opportunities of moving to a low carbon economy
Ricardo Energy & Environment
Ricardo in Confidence
Ref: Ricardo/ED10039 V7
Table A1B.7: Total LCE including adaptation (medium coefficient scenario)
TBR total employment
TBR total turnover
(£billions)
TBR GVA (£billions)
TBR LCE 2016
449,411
122.64
41.93
TBR Adaptation
16,084
2.30
0.92
TBR Total
465,495
124.94
42.85
Adaptation as a percent
of total LCE
3.5%
1.9%
2.1%
Source: TBR 2017
The totals compared to the ONS Low Carbon and Renewable Energy Economy Survey estimates are
shown in the two tables below.
Table A1B.8: LCE TBR vs ONS employment comparisons
Sector Group
ONS 2014
TBR 2015
Energy efficient products
155,500
90,882
Energy from waste and biomass
11,500
19,032
Low carbon electricity
40,500
161,242
Low carbon heat
7,000
41,977
Low carbon services
13,000
28,610
Low emission vehicles, infrastructure, fuels cells and energy
storage
11,000
18,387
Waste processing and materials recovery
Not included
89,281
Adaptation (medium scenario)
Not included
16,084
Total
238,500
465,495
Source: TBR 2017

UK business opportunities of moving to a low carbon economy
Ricardo Energy & Environment
Ricardo in Confidence
Ref: Ricardo/ED10039 V7
Table A1B.9: LCE TBR vs ONS turnover comparisons
Sector Group
ONS
2014
TBR 2015
Energy efficient products
24.17
17.02
Energy from waste and biomass
2.45
26.35
Low carbon electricity
10.27
34.04
Low carbon heat
37.82
7.63
Low carbon services
1.96
4.02
Low emission vehicles, infrastructure, fuels cells and energy
storage
6.76
9.64
Waste processing and materials recovery
Not
included
23.94
Adaptation (medium scenario)
Not
included
2.30
Total
83.42
124.94
Source: TBR 2017
Note: margins of error in the ONS data are as follows.
Sector group
Variance
Low carbon electricity
> 10% and < 20%
Low carbon heat
> 20% and < 30%
Energy from waste & biomass
> 10% and < 20%
Energy efficient products
< 10%
Low carbon services
> 20% and < 30%
Low emission vehicles
> 10% and < 20%

UK business opportunities of moving to a low carbon economy
Ricardo Energy & Environment
Ricardo in Confidence
Ref: Ricardo/ED10039 V7
Appendix 2 – Comparison of sectors and
technologies considered
Three analyses have been used in the current work:
Analysis by the Office of National Statistics of the size of the UK low carbon economy
Analysis by TBR Ltd of the size of the UK low carbon economy
Current analysis of the size and growth potential for opportunities arising from transition to a
low carbon economy
The first two analyses are intended to be comprehensive. The analysis of future opportunities covers:
All sectors for low carbon electricity apart from hydropower and nuclear
Low emission vehicles
Low carbon finance and insurance, but not other low carbon analysis services
Selected other low carbon opportunities
Broad estimate for adaptation
Broad estimate for the low carbon economy
Alignment of the areas covered by these analyses is given in Table A2.1

UK business opportunities of moving to a low carbon economy
Ricardo Energy & Environment
Ricardo in Confidence
Ref: Ricardo/ED10039 V7
Table A2.1: Alignment of the low carbon economy sectors considered by ONS, TBR and IEA and the technologies and areas considered in the current work
ONR Group
ONS Sector
TBR sector
IEA group
Technology/ measure,
current work
Area, current work
Sector grouping
used for
assessing % UK
share of global
market
Group for graph in
Section 4
Low carbon electricity
Offshore wind
Offshore Wind
Power
Onshore wind
Machinery /
Electrical Products
Low carbon electricity
Low carbon electricity
Onshore wind
Onshore Wind
Power
Offshore wind
Machinery /
Electrical Products
Low carbon electricity
Low carbon electricity
Solar photovoltaic
Solar PV
Power
Solar Photovoltaic (PV)
Machinery /
Electrical Products
Low carbon electricity
Low carbon electricity
Hydropower
Hydroelectric
energy
Power
Low carbon electricity
Other renewable
electricity
Marine
Power
Marine energy
Machinery /
Electrical Products
Low carbon electricity
Low carbon electricity
Carbon capture
and storage
Carbon capture and
storage
Power
Carbon capture and storage
Machinery /
Electrical Products
Low carbon electricity
Low carbon electricity
Nuclear
Nuclear energy
Power
Low carbon electricity
Power
Energy storage (Power)
Machinery /
Electrical Products
Low carbon electricity
Low carbon heat
Renewable heat
Geothermal heat
Residential
Low carbon heat
Solar thermal
Residential
Low carbon heat
Renewable
combined heat and
power
Heat networks
Residential
Low carbon heat
Heat pumps
Residential
Energy from waste and biomass
Bioenergy
Energy generation
from waste and
biomass
Industry
Energy from waste and biomass
Biomass equipment
Industry
Energy from waste and biomass
Alternative fuels
Alternative fuels
Industry
Alternative fuels
Biofuels
Chemicals /
Related Industries
Other low carbon
products and services
Energy efficient products
Energy efficient
lighting
Energy-efficient
lighting
Residential
Energy efficient products
Other energy
efficient products
Energy-efficient
windows and doors
Residential

UK business opportunities of moving to a low carbon economy
Ricardo Energy & Environment
Ricardo in Confidence
Ref: Ricardo/ED10039 V7
ONR Group
ONS Sector
TBR sector
IEA group
Technology/ measure,
current work
Area, current work
Sector grouping
used for
assessing % UK
share of global
market
Group for graph in
Section 4
Energy efficient products
Heat recovery and
ventilation
Residential
Energy efficient products
Insulation
Residential
Insulation
Advanced Insulation
Construction
Other low carbon
products and services
Energy efficient products
Sustainable
architecture
Residential
Energy efficient products
Power
Materials and Product
Substitution
Alternative Batteries
Machinery /
Electrical Products
Other low carbon
products and services
Energy efficient products
Transport
Materials and Product
Substitution
Alternative Magnets
Metals / Metal
Products
Other low carbon
products and services
Energy efficient products
Industry
Materials and Product
Substitution
Bioprocessing
Chemicals /
Related Industries
Other low carbon
products and services
Energy efficient products
Industry
Materials and Product
Substitution
Catalysts
Chemicals /
Related Industries
Other low carbon
products and services
Energy efficient products
Industry
Materials and Product
Substitution
Membranes
Chemicals /
Related Industries
Other low carbon
products and services
Energy efficient products
Energy monitoring,
saving or control
systems
Energy controls and
control systems
Residential
Energy controls and control
systems
Smart grids
Computer and
information
services
Other low carbon
products and services
Low carbon services
Low carbon
financial and
advisory services
Low carbon finance
Services
Low carbon finance
Green Finance
Financial services
Low carbon financial
services
Low carbon services
Services
Low carbon finance
Performance/lifetime
insurance
Insurance
Low carbon financial
services
Low carbon services
Low carbon
advisory services
Services
Low emission vehicles,
infrastructure, fuels cells and
energy storage
Low emission
vehicles and
infrastructure
Low emission
vehicles
Transport
Low emission vehicles
Transmission /
Engines
Transport
Equipment
(Not included as
already in figures for
vehicles)
Low emission vehicles,
infrastructure, fuels cells and
energy storage
Fuels cells and
energy storage
Transport
Low emission vehicles
Charging Solutions
Transport
Equipment
Low emission vehicles
Low emission vehicles,
infrastructure, fuels cells and
energy storage
Transport
Low emission vehicles
Fuel Cell Electric
Vehicles
Transport
Equipment
Low emission vehicles

UK business opportunities of moving to a low carbon economy
Ricardo Energy & Environment
Ricardo in Confidence
Ref: Ricardo/ED10039 V7
ONR Group
ONS Sector
TBR sector
IEA group
Technology/ measure,
current work
Area, current work
Sector grouping
used for
assessing % UK
share of global
market
Group for graph in
Section 4
Low emission vehicles,
infrastructure, fuels cells and
energy storage
Transport
Low emission vehicles
Electric Vehicles
Transport
Equipment
Low emission vehicles
Low emission vehicles,
infrastructure, fuels cells and
energy storage
Transport
Low emission vehicles
Hybrid electric
vehicles
Transport
Equipment
Low emission vehicles
Low emission vehicles,
infrastructure, fuels cells and
energy storage
Low emission vehicles
Logistics /
Telematics
Transport
Equipment
Low emission vehicles
Waste processing
and materials
recovery
Recycling of materials from
waste
Lithium Batteries
Machinery /
Electrical Products
Other low carbon
products and services
Adaptation
Adaptation
Construction
Box on adaptation
Circular Economy
Machinery /
Electrical Products
Box on circular
economy

UK business opportunities of moving to a low carbon economy
Ricardo Energy & Environment
Ricardo in Confidence
Ref: Ricardo/ED10039 V7
Appendix 3 - Data sources and assumptions for
estimating the size of future global markets
associated with the low carbon economy
See xls file “CCC Global Market Size Estimates_v01-17”
UK business opportunities of moving to a low carbon economy
Ricardo Energy & Environment
Ricardo in Confidence
Ref: Ricardo/ED10039 V7
Appendix 4 – Summary data from current analysis
[From “CCC Global Market Size Estimates_v01-17.xls”]
Table A4.1: Estimates of global market size for technologies and areas considered.
ID
Grouping
Technology /
Measure
Area
2015 Global
£m/year (low)
2015 Global
£m/year (high)
2030 Global
£m/year (low)
2030 Global
£m/year (high)
2050 Global
£m/year (low)
2050 Global
£m/year (high)
1
Low carbon
electricity
Onshore wind
59,000
59,000
77,000
82,000
120,000
150,000
2
Low carbon
electricity
Offshore wind
3,200
3,200
16,000
17,000
38,000
48,000
5
Low carbon
electricity
Marine energy
0
0
4,400
4,700
81,000
100,000
6
Low carbon
electricity
Solar Photovoltaic
(PV)
63,000
63,000
70,000
74,000
170,000
220,000
7
Low carbon
electricity
Carbon capture and
storage
1,200
1,200
86,000
170,000
150,000
360,000
8
Low carbon heat
Energy storage
(Power)
0
0
11,000
12,000
17,000
21,000
13
Waste processing,
energy from waste
and biomass
Recycling of
materials from
waste
Lithium
Batteries
120
120
3,400
3,400
12,000
12,000
15
Waste processing,
energy from waste
and biomass
Alternative fuels
Biofuels
160,000
180,000
400,000
470,000
1,200,000
1,400,000
20
Energy efficiency
products
Insulation
Advanced
Insulation
110,000
110,000
110,000
110,000
86,000
86,000
24
Energy efficiency
products
Energy controls and
control systems
Smart grids
72,000
72,000
320,000
450,000
360,000
500,000
29
Low carbon
services
Low carbon finance
Green Finance
11,000
32,000
60,000
260,000
96,000
430,000
30
Low carbon
services
Low carbon finance
Performance/lif
etime insurance
850
2,600
6,300
19,000
10,000
31,000
32
Other low carbon
Low emission
vehicles
Transmission
3,000
3,000
110,000
110,000
390,000
390,000
33
Other low carbon
Low emission
vehicles
Charging
Solutions
7,300
15,000
220,000
450,000
700,000
1,400,000

UK business opportunities of moving to a low carbon economy
Ricardo Energy & Environment
Ricardo in Confidence
Ref: Ricardo/ED10039 V7
ID
Grouping
Technology /
Measure
Area
2015 Global
£m/year (low)
2015 Global
£m/year (high)
2030 Global
£m/year (low)
2030 Global
£m/year (high)
2050 Global
£m/year (low)
2050 Global
£m/year (high)
34
Other low carbon
Low emission
vehicles
Fuel Cell
Electric
Vehicles
0
0
65,000
140,000
340,000
560,000
35
Other low carbon
Low emission
vehicles
Battery Electric
Vehicles
6,800
6,800
190,000
190,000
1,100,000
1,100,000
36
Other low carbon
Low emission
vehicles
Hybrid electric
vehicles
14,000
14,000
540,000
480,000
1,300,000
1,200,000
37
Other low carbon
Low emission
vehicles
Logistics /
Telematics
5,300
5,300
31,000
700,000
160,000
3,300,000
38
Other low carbon
Adaptation
50,000
65,000
120,000
270,000
270,000
440,000
39
Other low carbon
Circular Economy
0
0
800,000
1,600,000
1,400,000
2,700,000
43
Other low carbon
Materials and
Product Substitution
Alternative
Batteries
0
0
6,900
7,300
20,000
26,000
44
Other low carbon
Materials and
Product Substitution
Alternative
Magnets
6,900
6,900
260,000
270,000
910,000
920,000
46
Other low carbon
Materials and
Product Substitution
Bioprocessing
87,000
87,000
200,000
490,000
790,000
1,900,000
47
Other low carbon
Materials and
Product Substitution
Catalysts
16,000
20,000
27,000
34,000
49,000
62,000
48
Other low carbon
Materials and
Product Substitution
Membranes
16,000
18,000
68,000
93,000
350,000
570,000
Total
692,670
764,120
3,802,000
6,508,600
10,119,000
17,926,000

UK business opportunities of moving to a low carbon economy
Ricardo Energy & Environment
Ricardo in Confidence
Ref: Ricardo/ED10039 V7
Table A4.2: Estimates of UK home market size for technologies and areas considered.
ID
Grouping
Technology /
Measure
Area
2015 UK Home
Market £m (low)
2015 UK Home
Market £m (high)
2030 UK Home
Market £m (low)
2030 UK Home
Market £m (high)
2050 UK Home
Market £m (low)
2050 UK Home
Market £m (high)
1
Low carbon
electricity
Onshore wind
900
900
1,400
1,800
1,200
1,600
2
Low carbon
electricity
Offshore wind
970
970
2,900
3,700
2,600
3,300
5
Low carbon
electricity
Marine energy
0
0
110
150
530
670
6
Low carbon
electricity
Solar Photovoltaic
(PV)
430
430
1,300
1,600
2,000
2,500
7
Low carbon
electricity
Carbon capture and
storage
0
0
2,800
1,600
7,900
5,500
8
Low carbon heat
Energy storage
(Power)
0
0
640
820
350
430
13
Waste processing,
energy from waste
and biomass
Recycling of
materials from
waste
Lithium
Batteries
8
8
390
490
410
520
15
Waste processing,
energy from waste
and biomass
Alternative fuels
Biofuels
310
360
500
580
160
180
20
Energy efficiency
products
Insulation
Advanced
Insulation
3,700
3,700
3,400
3,400
2,400
2,400
24
Energy efficiency
products
Energy controls and
control systems
Smart grids
940
940
4,200
5,900
4,700
6,500
29
Low carbon
services
Low carbon finance
Green Finance
130
400
700
3,000
1,200
5,400
30
Low carbon
services
Low carbon finance
Performance/lif
etime insurance
11
32
74
220
1,200
5,400
32
Other low carbon
Low emission
vehicles
Transmission
210
210
3,400
4,800
7,300
8,200
33
Other low carbon
Low emission
vehicles
Charging
Solutions
460
940
7,400
20,000
14,000
32,000
34
Other low carbon
Low emission
vehicles
Fuel Cell
Electric
Vehicles
0
0
0
6,800
6,800
14,000
35
Other low carbon
Low emission
vehicles
Battery Electric
Vehicles
530
530
10,000
17,000
34,000
40,000
36
Other low carbon
Low emission
vehicles
Hybrid electric
vehicles
960
960
14,000
11,000
11,000
5,700

UK business opportunities of moving to a low carbon economy
Ricardo Energy & Environment
Ricardo in Confidence
Ref: Ricardo/ED10039 V7
ID
Grouping
Technology /
Measure
Area
2015 UK Home
Market £m (low)
2015 UK Home
Market £m (high)
2030 UK Home
Market £m (low)
2030 UK Home
Market £m (high)
2050 UK Home
Market £m (low)
2050 UK Home
Market £m (high)
37
Other low carbon
Low emission
vehicles
Logistics /
Telematics
140
170
600
13,000
2,200
46,000
38
Other low carbon
Adaptation
510
640
810
1,000
1,400
1,700
39
Other low carbon
Circular Economy
0
0
24,000
48,000
38,000
76,000
43
Other low carbon
Materials and
Product Substitution
Alternative
Batteries
0
0
390
490
410
520
44
Other low carbon
Materials and
Product Substitution
Alternative
Magnets
490
490
110
150
270
320
46
Other low carbon
Materials and
Product Substitution
Bioprocessing
2,900
2,900
6,100
15,000
22,000
52,000
47
Other low carbon
Materials and
Product Substitution
Catalysts
510
640
810
1,000
1,400
1,700
48
Other low carbon
Materials and
Product Substitution
Membranes
510
600
2,000
2,800
9,600
16,000
Total
14,619
15,820
88,034
163,130
173,030
328,290

UK business opportunities of moving to a low carbon economy
Ricardo Energy & Environment
Ricardo in Confidence
Ref: Ricardo/ED10039 V7
Table A4.3: Estimates of UK market share of global market (home market + exports) for technologies and areas considered.
ID
Grouping
Technology / Measure
Area
2015 Total
UK share
£m/year
(Low)
2015 Total
UK share
£m/year
(high)
2030 Total UK
share £m/year
(Low)
2030 Total UK
share £m/year
(high)
2050 Total UK
share £m/year
(low)
2050 Total UK
share £m/year
(high)
1
Low carbon electricity
Onshore wind
1,300
1,300
1,900
2,300
2,000
2,600
2
Low carbon electricity
Offshore wind
980
980
3,000
3,800
2,800
3,600
5
Low carbon electricity
Marine energy
0
0
140
180
1,100
1,300
6
Low carbon electricity
Solar Photovoltaic (PV)
840
840
1,800
2,100
3,100
3,900
7
Low carbon electricity
Carbon capture and
storage
8
8
3,300
2,700
8,800
7,800
8
Low carbon heat
Energy storage (Power)
0
0
710
890
460
570
13
Waste processing,
energy from waste and
biomass
Recycling of materials
from waste
Lithium Batteries
9
9
410
510
490
600
15
Waste processing,
energy from waste and
biomass
Alternative fuels
Biofuels
1,400
1,500
3,100
3,700
8,100
9,400
20
Energy efficiency
products
Insulation
Advanced Insulation
3,700
3,700
3,400
3,400
2,400
2,400
24
Energy efficiency
products
Energy controls and
control systems
Smart grids
1,400
1,400
6,200
8,600
6,900
9,600
29
Low carbon services
Low carbon finance
Green Finance
300
900
1,600
7,100
2,700
12,000
30
Low carbon services
Low carbon finance
Performance/lifetime
insurance
21
63
150
440
1,300
5,700
32
Other low carbon
Low emission vehicles
Transmission
250
250
4,900
6,300
13,000
14,000
33
Other low carbon
Low emission vehicles
Charging Solutions
560
1,100
10,000
26,000
24,000
51,000
34
Other low carbon
Low emission vehicles
Fuel Cell Electric
Vehicles
0
0
910
8,700
11,000
22,000
35
Other low carbon
Low emission vehicles
Battery Electric
Vehicles
620
620
13,000
19,000
49,000
55,000
36
Other low carbon
Low emission vehicles
Hybrid electric
vehicles
1,100
1,100
21,000
18,000
29,000
22,000
37
Other low carbon
Low emission vehicles
Logistics /
Telematics
210
240
1,000
23,000
4,400
91,000

UK business opportunities of moving to a low carbon economy
Ricardo Energy & Environment
Ricardo in Confidence
Ref: Ricardo/ED10039 V7
ID
Grouping
Technology / Measure
Area
2015 Total
UK share
£m/year
(Low)
2015 Total
UK share
£m/year
(high)
2030 Total UK
share £m/year
(Low)
2030 Total UK
share £m/year
(high)
2050 Total UK
share £m/year
(low)
2050 Total UK
share £m/year
(high)
38
Other low carbon
Adaptation
520
650
830
1,000
1,400
1,800
39
Other low carbon
Circular Economy
0
0
29,000
58,000
47,000
93,000
43
Other low carbon
Materials and Product
Substitution
Alternative Batteries
0
0
430
530
540
690
44
Other low carbon
Materials and Product
Substitution
Alternative Magnets
520
520
1,500
1,600
5,000
5,100
46
Other low carbon
Materials and Product
Substitution
Bioprocessing
3,500
3,500
7,400
18,000
27,000
64,000
47
Other low carbon
Materials and Product
Substitution
Catalysts
610
770
980
1,200
1,700
2,100
48
Other low carbon
Materials and Product
Substitution
Membranes
610
710
2,400
3,400
12,000
20,000
Total
18,458
20,160
119,060
219,290
265,190
500,930
UK business opportunities of moving to a low carbon economy
Ricardo Energy & Environment
Ricardo in Confidence
Ref: Ricardo/ED10039 V7
Table A4.4: List of 50 Market Segments reviewed.
ID
Grouping
Technology /
Measure
Area
Rationale
Priority
Assessed?
1
Low carbon electricity
Onshore wind
Lagging behind other major
economies
Low
Yes
2
Low carbon electricity
Offshore wind
Area of emerging UK strength
Medium
Yes
3
Low carbon electricity
Nuclear energy
Outside scope (Fusion,
Fission)
Not
Relevant
No
4
Low carbon electricity
Hydroelectric energy
Normally sourced from local
suppliers
Low
No
5
Low carbon electricity
Marine energy
Area of emerging UK strength
Medium
Yes
6
Low carbon electricity
Solar Photovoltaic
(PV)
Competing with lower cost
economies
Low
Yes
7
Low carbon electricity
Carbon capture and
storage
Lagging behind other major
economies but required
longer-term and some UK
strengths
High
Yes
8
Low carbon electricity
Energy storage
(Power)
Area of particular UK strength
High
Yes
9
Low carbon heat
Geothermal heat
Limited market size / home
market
Low
No
10
Low carbon heat
Heat pumps
Lagging behind other major
economies
Low
No
11
Low carbon heat
Solar thermal
Lagging behind other major
economies
Low
No
12
Waste processing, energy
from waste and biomass
Heat networks
Normally sourced from local
suppliers
Low
No

UK business opportunities of moving to a low carbon economy
Ricardo Energy & Environment
Ricardo in Confidence
Ref: Ricardo/ED10039 V7
ID
Grouping
Technology /
Measure
Area
Rationale
Priority
Assessed?
13
Waste processing, energy
from waste and biomass
Recycling of materials
from waste
Lithium Batteries
Area of existing UK strength
Medium
Yes
14
Waste processing, energy
from waste and biomass
Energy from waste
and biomass
Normally sourced from local
suppliers
Low
No
15
Waste processing, energy
from waste and biomass
Alternative fuels
Biofuels
Area of emerging UK strength
Medium
Yes
16
Waste processing, energy
from waste and biomass
Alternative fuels
Hydrogen
Constrained by resource
availability
Low
No
17
Waste processing, energy
from waste and biomass
Alternative fuels
Other
Normally sourced from local
suppliers
Low
No
18
Waste processing, energy
from waste and biomass
Biomass equipment
Lagging behind other major
economies
Low
No
19
Energy efficiency products
Energy-efficient
lighting
Existing market / technology
Not
Relevant
No
20
Energy efficiency products
Insulation
Advanced Insulation
Area of existing UK strength
Medium
Yes
21
Energy efficiency products
Energy-efficient
windows and doors
Existing market / technology
Not
Relevant
No
22
Energy efficiency products
Heat recovery and
ventilation
Existing market / technology
Not
Relevant
No
23
Energy efficiency products
Energy controls and
control systems
Smart Meters
Existing market / technology
Not
Relevant
No
24
Energy efficiency products
Energy controls and
control systems
Smart grids
Area of emerging UK strength
Medium
Yes
25
Energy efficiency products
Energy controls and
control systems
Energy Management
Covers multiple
solutions/technologies
Non-
Specific
No

UK business opportunities of moving to a low carbon economy
Ricardo Energy & Environment
Ricardo in Confidence
Ref: Ricardo/ED10039 V7
ID
Grouping
Technology /
Measure
Area
Rationale
Priority
Assessed?
26
Energy efficiency products
Sustainable
architecture and
buildings
BIPV
Area of emerging UK strength
Medium
NO
27
Energy efficiency products
Other energy efficient
equipment
Existing market / technology
Not
Relevant
No
28
Low carbon services
Low carbon advisory
Covers multiple
solutions/technologies
Non-
Specific
No
29
Low carbon services
Low carbon finance
Green Finance
Area of particular UK strength
High
Yes
30
Low carbon services
Low carbon finance
Performance/lifetime
insurance
Area of particular UK strength
High
Yes
31
Low carbon services
Low carbon
management
Covers multiple
solutions/technologies
Non-
Specific
No
32
Other low carbon
Low emission vehicles
Transmission
Area of particular UK strength
High
Yes
33
Other low carbon
Low emission vehicles
Charging Solutions
Area of emerging UK strength
Medium
Yes
34
Other low carbon
Low emission vehicles
Fuel Cell Electric Vehicles
Area of emerging UK strength
Medium
Yes
35
Other low carbon
Low emission vehicles
Battery Electric Vehicles
Area of emerging UK strength
Medium
Yes
36
Other low carbon
Low emission vehicles
Hybrid electric vehicles
Lagging behind other major
economies
Low
Yes
37
Other low carbon
Low emission vehicles
Logistics / Telematics
Area of emerging UK strength
Medium
Yes
38
Other low carbon
Adaptation
Early stage of technology
development
Non-
Specific
Yes
39
Other low carbon
Circular Economy
Early stage of technology
development
Non-
Specific
Yes

UK business opportunities of moving to a low carbon economy
Ricardo Energy & Environment
Ricardo in Confidence
Ref: Ricardo/ED10039 V7
ID
Grouping
Technology /
Measure
Area
Rationale
Priority
Assessed?
40
Other low carbon
Low carbon
manufacturing
Lean / Agile Manufacturing
Area of particular UK strength
High
No
41
Other low carbon
Low carbon
manufacturing
Lightweighting /
Dematerisation
Area of particular UK strength
High
No
42
Other low carbon
Low carbon
manufacturing
Other
Covers multiple
solutions/technologies
Non-
Specific
No
43
Other low carbon
Materials and Product
Substitution
Alternative Batteries
Area of particular UK strength
High
Yes
44
Other low carbon
Materials and Product
Substitution
Alternative Magnets
Constrained by resource
availability
Low
Yes
45
Other low carbon
Materials and Product
Substitution
Alternative materials
(Other)
Competing with lower cost
economies
Low
NO
46
Other low carbon
Materials and Product
Substitution
Bioprocessing
Area of particular UK strength
High
Yes
47
Other low carbon
Materials and Product
Substitution
Catalysts
Area of particular UK strength
High
Yes
48
Other low carbon
Materials and Product
Substitution
Membranes
Area of particular UK strength
High
Yes
49
Other low carbon
Materials and Product
Substitution
Rare Elements Alternatives
Constrained by resource
availability
Low
NO
50
Other low carbon
Materials and Product
Substitution
Other
Covers multiple
solutions/technologies
Non-
Specific
No

UK business opportunities of moving to a low carbon economy
Ricardo Energy & Environment
Ricardo in Confidence
Ref: Ricardo/ED10039 V7
A4.5: Compound Annual Growth Rates (CAGR) used in 2030 & 2050 projections
Low carbon economy (LCE)
sector
71
Study Area based on
2015-2030
2030-2050
Energy efficient products
Low carbon other
6.9%
5.0%
Energy from waste and biomass
Low carbon other
6.9%
5.0%
Low carbon electricity
Low carbon electricity
8.7%
2.8%
Low carbon heat
Low carbon other
6.9%
5.0%
Low carbon services
Low carbon services
13.3%
4.3%
Low emission vehicles,
infrastructure, fuels cells and
energy storage
Low emission vehicles
23.6%
4.8%
Waste processing and materials
recovery
Low carbon other
6.9%
5.0%
71
The sectors in this table have been used by the Office of National Statistics to present the size of the UK low carbon economy. As this report
relates to opportunities for the UK low carbon economy, these sectors will be used from this point onwards. A comparison of the sub-sectors
included by ONS and by the analyses in this report is in Appendix 2.

The Gemini Building
Fermi Avenue
Harwell
Didcot
Oxfordshire
OX11 0QR
United Kingdom
t: +44 (0)1235 753000
e: enquir[email protected]
ee.ricardo.com
