
Department of Commerce // National Oceanic and Atmospheric Administration
Drought Information Statement for
South Central Texas
Valid September 5, 2024
Issued By: NWS Austin/San Antonio
Contact Information: [email protected]
● This product will be updated October 3, 2024 or sooner if drought conditions change significantly.
● Please see all currently available products at https://drought.gov/drought-information-statements.
● Please visit https://www.weather.gov/ewx/DroughtInformationStatement for previous statements.
● Please visit https://www.drought.gov/drought-status-updates/ for regional drought status updates.
● Some much needed rain occurred over the western part of the service
area to provide improvement of drought conditions
● Reservoir levels across the service area saw some improvement while
overall water storage remains low
● Monthly outlooks show potential for additional improvement of
drought conditions through the month of September

National Weather Service
Austin/San Antonio, TX
U.S. Drought Monitor
● Drought intensity and Extent
○ D3 (Extreme Drought): Covers portions of the Hill
Country
■ Percent of Area: 1.70%
○ D2 (Severe Drought): Extends across the portions
of the Hill Country
■ Percent of Area: 7.04%
○ No Drought or D0 (Abnormally Dry):
Encompasses the Coastal Plains, and portions of
the Hill Country, Southern Edwards Plateau, I-35
corridor, and Rio Grande Plains
■ Percent of Area: 67.92%
Link to the latest U.S. Drought Monitor for south central Texas

National Weather Service
Austin/San Antonio, TX
Recent Change in Drought Intensity
Link to the latest 4-week change map for south central Texas
● Four Week Drought Monitor Class
Change.
○ Drought Worsened: primarily over
Williamson County saw drought
conditions worsen
○ No Change: portions of the I-35
corridor, Hill Country, and southern
Edwards Plateau, and Rio Grande
Plains
○ Drought Improved: Much of the Rio
Grande plains, and southern
Edwards Plateau saw improvement
over the last 30 days.

National Weather Service
Austin/San Antonio, TX
Precipitation
Links to the latest Precipitation Accumulation and Percent of Normal over the past 30 days
The service area divided into roughly
three zones of rainfall for the past 30
days.
● Well below normal rainfall
was seen over portions of the
I-35 corridor, Coastal Plains,
and Winter Garden with
decent swaths of less than
25% of normal
● Portions of the Hill Country,
I-35 corridor, and Coastal
Plains saw slightly below to
near normal rainfall
● And a late August/early
September deluge brought
portions of the Rio Grande
Plains, southern Edwards
Plateau into near to well
above normal percentages

National Weather Service
Austin/San Antonio, TX
Summary of Impacts
Links: See/submit Condition Monitoring Observer Reports (CMOR) and view the Drought Impacts Reporter
Hydrologic Impacts
● The majority of watersheds across the service area fall within either the
normal to above normal percentile classification given the late
August/early September rainfall (USGS)
● However, the Frio River, and portions of the Guadalupe River and lower
Colorado river basins remain in the below to much below percentile
classifications.(USGS)
● See next page for more details
Agricultural Impacts
● Please see the latest Crop & Weather Report from Texas A&M Agrilife
● Soil moistures across the service area are shown in the normal range
(NWS Climate Prediction Center)
Fire Hazard Impacts
● Normal wildland fire activity is forecast through the month of
September (National Interagency Coordination Center)
● See Fire Hazard page for more details
Drought Mitigation Actions
● Please refer to your municipality and/or
water provider for mitigation
information.
● Select Municipality Restrictions (as of
9/5/2024)
○ City of Uvalde: Stage 5
○ City of Fredericksburg: Stage 4
○ City of Kerrville: Stage 3
○ City of San Antonio: Stage 3
○ City of Universal City: Stage 3
○ City of Georgetown: Stage 2
○ City of New Braunfels: Stage 2
○ City of Austin: Stage 2
○ City of Del Rio: Stage 2
○ City of Llano: Stage 2

National Weather Service
Austin/San Antonio, TX
Hydrologic Conditions and Impacts
Reservoir
Pool
Elevation
Current
Elevation
Percent
Full
Amistad
1117.00 feet 1049.68 feet
25.7%
Medina Lake
1064.2 feet 974.78 feet
3.3%
Canyon Lake
909.00 feet 884.72 feet
55.9%
Granger Lake
504.00 feet 504.49 feet
100%
Georgetown
Lake
791.00 feet 782.96 feet
74.6%
Lake
Buchanan
1020.00 feet 1005.39 feet
69.0%
Lake LBJ
825.00 feet 824.63 feet
97.9%
Lake Marble
Falls
738.00 feet 736.38 feet
95.1%
Lake Travis
681.00 feet 642.64 feet
48.4%
Lake Austin
492.9 feet 492.16 feet
95.8%
Figure Caption: USGS 7 day streamflows for Texas,
valid September 4, 2024
Table caption: TWDB Reservoir conditions as of
September 5, 2024
● The majority of watersheds
across the service area fall within
either the normal to above
normal percentile classification
given the late August/early
September rainfall
● However, the Frio River, and
portions of the Guadalupe River
and lower Colorado river basins
remain in the below to much
below percentile classifications.
Additional data:
Edwards Aquifer, Bexar Index Well J-17 as
of September 5, 2024:
10 day average: 630
Historical Monthly Average: 659.9
Departure from Average: -27.1

National Weather Service
Austin/San Antonio, TX
Agricultural Impacts
Links to the latest Soil Moisture Ranking Percentile and Crop Moisture Index by Division.
● Soil moistures across the service area are shown in the
normal range
● Crop moisture index values show excessively dry
conditions across all of the climate zones within our service
area

National Weather Service
Austin/San Antonio, TX
Fire Hazard Impacts
● Keetch Byram Drought
Index values of 0 to 300
range across the
southern Edwards
Plateau, Rio Grande
Plains, and portions of
the Hill Country
● Values range between
500 and 600 across the
I-35 corridor
● Normal wildland fire
activity is forecast
through the month of
September
Burn bans remain for 18 of our 33 counties as of
September 4, 2024. Latest County Burn Ban
map available here.
Link to Wildfire Potential Outlooks from the National Interagency Coordination Center.
National Weather Service
Austin/San Antonio, TX
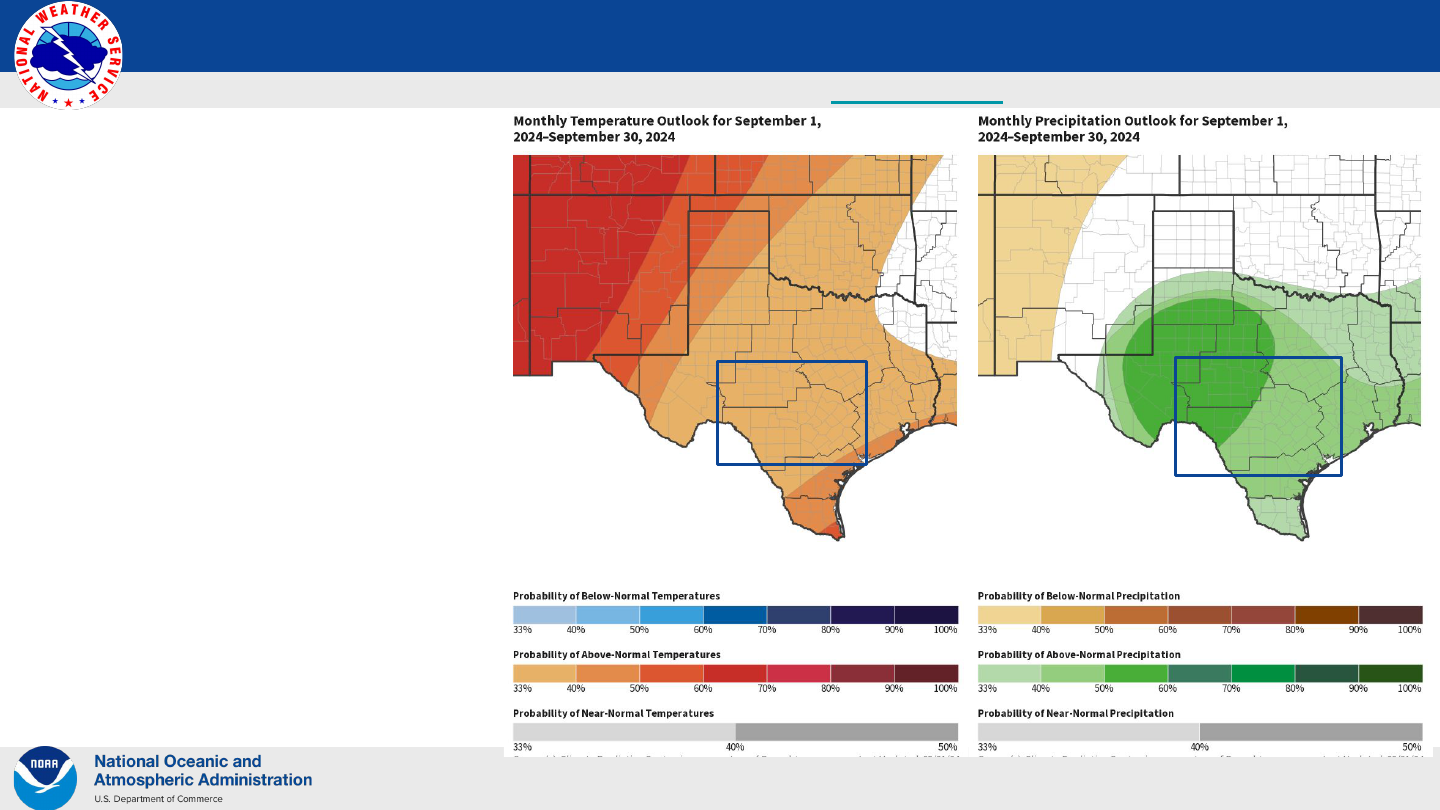
Long-Range Outlooks
The latest monthly and seasonal outlooks can be found on the CPC homepage
● The temperature outlook for
the month of September leans
towards above normal for much
of the service area
● The precipitation outlook leans
towards above normal rainfall
for all of the service area
○ Chances are higher for
portions of the Rio
Grande and southern
Edwards Plateau

National Weather Service
Austin/San Antonio, TX
Drought Outlook
● The monthly drought outlook for
September shows chances of
drought improvement or ended for
portions of the I-35 corridor, Rio
Grande Plains, Hill Country, and
southern Edwards Plateau
● The three month outlook mirrors the
monthly outlook showing drought
improvement through November
Links to the latest:
Climate Prediction Center Monthly Drought Outlook
Climate Prediction Center Seasonal Drought Outlook
The latest monthly and seasonal outlooks can be found on the CPC homepage

-southern.png)