Report Aligned with the 11 TCFD
recommendations
LATAM Airlines Group
With the support of South Pole
Version
Publication date
Document type
1.0
August / 2024
Procedure

Title
Report Aligned with the 11 TCFD recommendations
Version
1.0
1. Context
LATAM Airlines Group S.A. (LATAM) is a multinational airline based in Santiago, Chile. Together with
its subsidiaries, in 2022 it connected 144 destinations in 22 countries and 154 destinations including
its cargo operations.
The operations of LATAM subsidiaries in Brazil, Colombia, Ecuador, and Peru reached or exceeded
figures recorded in 2019 before the pandemic in terms of capacity, while LATAM Chile's recovery has
been a little slower. In the calendar year 2022, around 25.3 million passengers were transported
within Chile, representing an increase of 44.4% over 2021. Demand increased by 41.8% in
Spanish-speaking countries, while the average occupancy was 81% with an increase of 6.2% over
2021. On the other hand, in Brazil, a total of 28.6 million passengers were transported. In the
international market, which considers regional flights and long-haul flights to three continents,
LATAM served 46 destinations in 22 countries, and in 2022 re-opened 14 routes that were
suspended due to the COVID-19 pandemic. Average service supply increased by 142.3% compared
to 2021 and average demand increased by 204.7% to 8.6 million passengers carried by the LATAM
group, with a load factor of 83%.
In response to increasing investor interest in corporate management and disclosure of climate-related
risks and opportunities, in 2023 LATAM identified and assessed its climate-related risks and
opportunities using scenario analysis. Using the outputs of this work, in this report LATAM seeks to
align its climate risk disclosure with the recommendations from the Task Force on Climate-Related
Financial Disclosures (TCFD), including as they relate to incorporating key risks and opportunities
within enterprise risk management (ERM) processes. This report (for internal use) is used as the basis
for LATAM’s summary TCFD disclosures within the annual report.
Whilst the narrative (including risk updates) in this report reflects reporting year 2023, the data in
the report is specific to reporting year 2022. The data will subsequently be updated with 2023 data
when available.
2. Scope
Given the scope of LATAM’s operations, which include over 154 destinations, for this report, LATAM
chose to focus on 56 of its main locations/airports, which are detailed in Table 1 below. These
airports were identified following the methodology described in detail in the Risk management
section.
August/ 2024
Página 2 de 42

Title
Report Aligned with the 11 TCFD recommendations
Version
1.0
Table 1. Scope of airports analysed in this report
Airports
Hercilio Luz International Airport
Ministro Pistarini International Airport
Alejandro Velasco Astete International Airport
Aeroporto de São Paulo/Congonhas
Lynden Pindling International Airport
Inca Manco Capac International Airport
Aeroporto Internacional do Rio de Janeiro - Galeão
Orlando International Airport
Coronel FAP Carlos Ciriani Santa Rosa
International Airport
São Paulo-Guarulhos International Airport
Mario Pereira Lopes Airport
Ilo Airport
Silvio Pettirossi International Airport
Mexico City International Airport
Francisco Carle Airport
Santos Dumont Airport
Adolfo Suárez Madrid-Barajas Airport
Jaen Airport
Seymour Airport
Punta Cana International Airport
Cap. FAP Pedro Canga Rodriguez Airport
José Joaquín de Olmedo International Airport
Jose Maria Cordova International Airport
FAP Captain Guillermo Concha Iberico
International Airport
Mariscal Sucre International Airport
Viru Viru International Airport
FAP Captain Jose Abelardo Quiñones Gonzales
International Airport
Mariscal Lamar International Airport
Cerro Moreno International Airport
FAP Captain Carlos Martínez de Pinillos International
Airport
Francisco de Orellana Airport
El Loa Airport
Cad. FAP Guillermo del Castillo Paredes Airport
Eloy Alfaro International Airport
Diego Aracena International Airport
Coronel FAP Francisco Secada Vignetta International
Airport
San Cristobal Airport
Carriel Sur International Airport
Mayor General FAP Armando Revoredo Iglesias
Airport
Ciudad de Catamayo Airport
El Tepual Airport
Miami International Airport
El Dorado International Airport
Presidente Carlos Ibanez del Campo International
Airport
Comodoro Arturo Merino Benitez International Airport
Jorge Chavez International Airport
Joinville-Lauro Carneiro de Loyola Airport
Mataveri International Airport (Isla de Pascua Airport)
John F. Kennedy International Airport
Brasilia International Airport (Presidente
J. Kubitschek Int'l Airport)
Carrasco Gral. Cesareo L. Berisso International Airport
Salgado Filho International Airport
Gustavo Rojas Pinilla International Airport
Capitan FAP VIctor Montes Arias International Airport
Navegantes-Ministro Victor Konder
International Airport
Rodriguez Ballon International Airport
3. Alignment with the TCFD recommendations
3.1. Governance
● Board's oversight of climate-related risks and opportunities.
LATAM is presided over by two governance bodies, the Board of Directors and the Directors’
Committee. Regarding climate-related issues, the Board of Directors has appointed a Sustainability &
Strategy Committee to analyze results and make strategic decisions related to sustainability issues.
This committee is the highest authority addressing climate-related issues and progressing goals and
commitments. It reports to the Board of Directors on a quarterly basis.
The Strategy and Sustainability Committee is responsible for developing, implementing, and
reporting progress against the sustainability strategy, which is centered on the following three
strategic pillars:
August/ 2024
Página 3 de 42

Title
Report Aligned with the 11 TCFD recommendations
Version
1.0
● Shared Value (‘Valor compartido’)
● Climate Change (‘Cambio Climático’)
● Circular Economy (‘Economía Circular’)
Each of the pillars includes specific goals and objectives as well as key performance indicators (KPIs)
that involve internal and external stakeholders for their achievement. Similarly, in developing the
goals and objectives of each pillar, the United Nations Sustainable Development Goals (SDGs) were
taken into account.
● Management’s role in assessing and managing climate-related risks and opportunities.
The sustainability strategy guides LATAM’s efforts in assessing and managing sustainability and
climate-related issues. To track progress against sustainability and climate goals, a set of KPIs has
been developed and is monitored by the Sustainability, Security, and Fuel management areas. The
executives leading the initiatives related to the three strategic pillars are presented in Table 2. In
conjunction with the management areas, the executives report annually to the Board of Directors on
the progress of the sustainability strategy and key climate-related issues.
Table 2. Executives leading the initiatives within LATAM’s strategic pillars
Strategic pillar
Internal team
Position
Climate Change
Corporate Sustainability Team Leader
Sustainability Chief
LATAM Executive Committee
LATAM Financial VP
Shared Value
Corporate Sustainability Team
Sustainability Chief
LATAM Executive Committee
Planification Senior
Manager
Circular Economy
Corporate Sustainability Team
Sustainability Chief
LATAM Executive Committee
LATAM Clients VP
Transversal through all
pillars
Corporate Sustainability Team
Sustainability Manager
Corporate Sustainability Team
Sustainability Director
At the management level, the Corporate Affairs and Sustainability Team is responsible for identifying
environmental and social risks, which are consolidated and reported to the Executive Committee and
the LATAM Risk Management Unit, who are responsible for their integration into the organization's
risk management matrix and subsequent management.
August/ 2024
Página 4 de 42

Title
Report Aligned with the 11 TCFD recommendations
Version
1.0
The results of the risk analysis guide the decision-making process on how to manage the identified
risks, led by the Sustainability and Strategy Committee of the Board of Directors, and supported by
the Audit Committee and key members within the Sustainability & Strategy, Leadership, Finance and
Clients business functions.
3.2. Strategy
● Climate-related risks and opportunities the organization has identified over the short,
medium, and long term.
LATAM's environmental performance is described in the Commitment to the Future (‘Compromiso
con el futuro’) section of the integrated report, which shows environmental performance indicators
and targets relating to the company's carbon footprint and broader resource and waste management.
These indicators and metrics are presented in Table 7. Furthermore, in 2022 LATAM began a process
to align with the TCFD recommendations in its annual reporting, continuing in 2023 and 2024 with a
climate-related risk and opportunity assessment and scenario analysis.
Based on the risk identification assessment process (described in detail in the Risk management
section), Table 3 below highlights the climate-related risks and opportunities LATAM identified
across the business in the short, medium and long term, as well as their potential impacts.
August/ 2024
Página 5 de 42

Title
Report Aligned with the 11 TCFD recommendations
Version
1.0
Table 3. Summary of the climate scenario assessment for the key physical and transition risks and opportunities identified
Type of
risk
Risk
Short-term risk
rating reflecting
current/actual risk
(2025)
Change in risk under
future climate
scenarios* (2030 and
2050)
Potential impacts for LATAM Airlines Group
Physical
acute
Extreme
temperatures
Low
2030: Moderate
Extreme temperatures can result in:
Making takeoff impossible on certain runways that are too short;
Accelerating the deterioration of the tarmac over time, causing
operational disruption;
High temperatures reduce air density and, therefore, aircraft load
capacity, reducing revenues;
Extreme temperatures lead to higher office operating costs due
to increased demand for air conditioning.
Airports under a “very high” risk are projected to double by 2050
(vs 2030) from 25% to 55%. Top 3 airports with the largest
increases in annual maximum temperatures by 2050 are Adolfo
Suárez Madrid-Barajas, Mario Pereira Lopes and Viru Viru, with
an increase of over 3°C vs historical period.
2050: High
Physical
acute
Coastal
flooding**
Very Low
2030: Very Low
Riverine and coastal flooding can result in:
Inability to use access roads and transport networks surrounding
the airport, leading to service disruption and impeding
passenger access;
Disruption of air traffic and economic losses in terms of reduced
revenues from a decrease in passenger and freight traffic;
Damage to airport infrastructure such as landing lights, radar
and navigation facilities and communications networks,
increasing costs from infrastructure repairs and construction;
Flooding of airport terminals, emergency power facilities and
2050: Very Low
Physical
acute
Riverine
flooding**
Low
2030: Low
August/ 2024
Página 6 de 42

Title
Report Aligned with the 11 TCFD recommendations
Version
1.0
transport routes between terminals requiring airports to
temporarily close, leading to operational disruption and reduced
revenues from ticket fares.
For coastal flooding, projections show a higher probability for
José Joaquín de Olmedo (GYE) and Santos Dumont (SDU)
airports, with flooding exceeding 5 cm but staying below 10
cms.
Nine airports have some level of flooding projected, both for the
baseline and modeled scenarios.
Some airports projected to have floods below 5cms, between
2030 and 2050 are: Navegantes-Ministro Victor Konder (NVT),
Gustavo Rojas Pinilla (ADZ), Eloy Alfaro (MEC), Capitán Carlos
Martínez de Pinillos (TRU), Seymour (GPS), Carrasco Gral.
Cesáreo L.Berisso (MVD) y Presidente Carlos Ibáñez del Campo
(PUQ).
As for riverine flooding, 40 airports are projected to have some
flooding in a 5km radius, with 11 of them to reach above 10cms
flooding.
By 2050, the highest average of riverine flooding events is
projected for Francisco de Orellana (OCC) airport, where floods
could surpass 1.6 m, followed by Coronel Francisco Secada
Vignetta (IQT) airport, with a high of 1.4 m.
Additionally, Gustavo Rojas Pinilla (ADZ) and John F. Kennedy
(JFK) airports are projected under high risk, with a flood high of
0.7 m and 0.63 m respectively.
2050: Low
Physical
acute
Heavy rainfall
High
2030: Low
An increase in heavy rainfall events could result in:
Localised surface water flooding, leading to disruption or delays
in airline operations;
Flooding near airports, making it difficult for passengers and
workers to arrive and causing operational disruptions.
August/ 2024
Página 7 de 42

Title
Report Aligned with the 11 TCFD recommendations
Version
1.0
Airports exposed to moderate and higher risk are projected to
increase from 2030 to 2050. Also, those at highest risk in 2050
are located in Galapagos Islands (Ecuador) and Junín, El Callao
and La Libertad (Peru), with other airports in the region (Chile
and mainland Ecuador) also projected to have significant
increases in the risk of heavy rainfall.
2050: Moderate
Physical
acute
Thunderstorm
s
High
2030: Moderate
An increase in the number of thunderstorms could result in:
Health and safety risks to air and ground personnel, possibly
increasing costs forms insurance and operational disruptions;
Operational disruptions due to ICAO recommendations to
suspend operations when lightning is detected within a 5km
radius.
Airports exposed to high and very high risk in 2050 are
projected to increase significantly compared to 2030. Those with
the highest risk of thunderstorms in 2050 are 2: Galapagos
Islands (Ecuador) and Junín (Peru), with other airports in the
region (Colombia and mainland Ecuador) also projected to have
significant increases in this risk.
2050: Moderate
Physical
acute
Strong
winds**
Very Low
2030: Low
An increase in strong winds could result in:
Disruptions at key hubs, which could cause disruption in
operations;
Damage airport infrastructure or even result in temporary
cessation of ground operations, increasing costs from repairs
and new infrastructure;
Impacts on aircraft takeoff, causing delays and cancellations, or
total cessation of ground operations, impacting revenues.
For all risk levels, the number of exposed airports are projected
to remain stable in 2050 compared to 2030. Those with very
high risk due to projected future annual maximum speeds are
located in New York (United States), Nassau (Bahamas), and
2050: Low
August/ 2024
Página 8 de 42

Title
Report Aligned with the 11 TCFD recommendations
Version
1.0
Easter Island (Chile), followed by airports located in Montevideo
(Uruguay), Magallanes (Chile), San Andres (Colombia) and
Punta Cana (Dominican Republic) with a high risk rating. And
projections indicate that there will be no considerable increase in
the risk of strong winds in 2050 compared to 2030.
For the short-term risk, 2025, the average risk level decreases
from very high to low.
Physical
acute
Storms
(tropical
cyclones)
Moderate
2030: Very Low
Severe storms could result in:
Damages to office and airport infrastructure, increasing
operating costs from repairs or new infrastructure;
Potential impact on aircraft engine performance and
maintenance requirements due to storm damage, increasing
operational costs;
Disruption of oil and jet fuel supplies in regions where oil is
refined, increasing operational and supply costs in the fuel value
chain.
In the medium and long term, Gustavo Rojas Pinilla International
Airport at San Andres is the only site projected to have increases
in wind speed with a 50-year return period, placing it in the low
risk category, with an increase of 3% and 4.7% in the medium
and long term, respectively. Meanwhile In the short term, the
risk for this airport was also determined to be low, according to
the Saffir-Simpson scale.
For airports in New York (JFK) and Mexico City (MEX) the climate
indicator is projected to decrease. While those in Florida (MIA &
MCO), Nassau (NAS), and Punta Cana (PUJ) are projected to
have very low increases in TCV (Tropical Cyclone Velocity),
relative to the short term.
2050: Very Low
August/ 2024
Página 9 de 42

Title
Report Aligned with the 11 TCFD recommendations
Version
1.0
Physical
acute
Clear-air
turbulence
Uncertain
2030: Uncertain
Increased turbulence in the air could result in:
Damage to aircraft, with possible diversions and changes in
routes, increasing operational costs and possible disruptions;
Health and safety risks to passengers and crew, causing
operational disruptions and potential reputational impacts, and
increasing costs from insurance premiums.
In the North Atlantic, models conclude that for every 1°C
increase in global temperature, moderate turbulence is projected
to increase 14% in autumn and summer, 9% in winter and
spring. This could affect flights to and from New York, where the
annual maximum temperature by 2050 is projected to increase
by nearly 2.5°C. In South America, the largest increases in
moderate turbulence are projected to occur in the March-August
period.
2050: High
Physical
acute
Wildfires
Low
2030: Low
Increases in wildfires could result in:
Reduced visibility at airports and cause changes in air routes,
possibly disrupting operations;
Health and safety risks to air and ground personnel, increasing
costs from insurance premiums;
If fires occur near airports or offices, operations are likely to be
disrupted.
The main increase in forest fires is expected to be due to a
decrease in total precipitation along with increasing
temperatures in the region - especially in the Amazon, where
the region's optimal conditions for forest fires may change from
42% today to 63% in 2050 under a 4°C increase scenario.
In South America, the annual burned area is projected (by 2050
under a 4°C scenario) to change from 0.7 Mkm2 to 2.5 Mkm2 -
mostly in the Amazon and the Cerrado region of Brazil.
The Chilean and Peruvian coastal zone, where most of LATAM's
2050: Moderate
August/ 2024
Página 10 de 42

Title
Report Aligned with the 11 TCFD recommendations
Version
1.0
airports are located, does not show major changes by 2050.
Transiti
on
opportu
nity
Ability to
transition
technologicall
y to a
low-carbon
economy
Low
2030: High
Technological advancements supporting lower-carbon aviation
could result in:
Increased profit by reducing operating costs related to fossil fuel
consumption and carbon emissions;
Reputational benefits from sustainable practices, helping to
maintain an increasingly environmentally conscious consumer
base and securing revenues;
Avoiding penalties related to environmental regulatory
non-compliance, reducing possible operational costs;
Positioning as a leader in the implementation of technological
innovations, and a potential increase in LATAM's valuation
and/or attraction of sustainable financial capital.
Aviation, highly dependent on fossil fuels, requires investment in
innovation and implementation of low-carbon technology;
however, the use of Sustainable Fuels (SAF) is the most viable
option in the medium term, at least for flights and routes of
more than 1,000 km. Likewise, there are technologies that could
be implemented on short or regional flights, but these are still in
the process of developing and depend on corporate measures
such as the renewal of aircraft or regulatory measures that
allow the supply chain to be developed and therefore deployed
in regions such as Latin America.
Results of the scenario analysis:
- 2025 [Moderate]: Efficiency and decarbonisation opportunities
for aviation have been identified and a strategy has been
mapped out in the sector for 2025 and 2030 going forward.
2050: High
August/ 2024
Página 11 de 42

Title
Report Aligned with the 11 TCFD recommendations
Version
1.0
- 2030 [High]: Sustained growth in production and availability of
SAF is expected from 2028 onwards. In addition, technological
innovations in propulsion and airframe systems could increase
aircraft efficiency by 10% and 20% in the long term. Regional
producers are expected to incentivise the use of more efficient
aircraft.
- 2050 [High]: Up to 65% CO2 reduction in aircraft operation is
expected by 2050.
Transiti
on
policy
risk
Exposure to
carbon prices
that include
the aviation
sector
Low
2030: High
Increased exposure and prices for carbon that include the
aviation sector could result in:
Increased operating costs due to the implementation of a carbon
tax on Scope 1 emissions;
Higher fuel costs due to the implementation of a carbon price
that passes through the value chain, increasing operating costs;
Increased operating costs leading to higher ticket prices,
reducing consumer demand and potentially impacting its market
share in the region in the event that other airlines are more
proactively reducing their energy and carbon footprint.
In Latin America there are no costs or mechanisms that apply
direct costs to the aviation sector, however, there are carbon
taxes that in some cases affect fuels such as jet fuel. Also, an
increase in carbon costs is expected in developing countries with
Net Zero commitments by 2050, such as Chile and Brazil, which
could increase fares and reduce demand for regional flights.
However, the uptake of SAF and low-carbon technologies are
expected to reduce the exposure of these costs in the medium to
long term.
Results of the scenario analysis:
2050: Very High
August/ 2024
Página 12 de 42

Title
Report Aligned with the 11 TCFD recommendations
Version
1.0
- 2025 [Low]: Currently, no country in Latin America has an
emissions trading system, however, Chile, Colombia and Mexico
have a tax on fossil fuels, although only in Colombia does it
apply to aviation fuels.
- 2030 [High]: A carbon price is expected to be implemented in
all Latin American countries, with an expected price of USD 90
per tCO2e by 2030, an increase of 77% compared to 2022.
- 2050 [Very high]: The regional carbon price is expected to
increase to USD 200 per tCO2e by 2050, an increase of 120%
compared to 2022 prices.
Transiti
on
market
risk
Changes in
passenger/con
sumer
behavior and
preferences
Low
2030: Low
Changes in consumer behaviours regarding aviation and air
travel could result in:
Reduction in demand for air services due to environmentally
conscious customers switching to other means of transportation,
possibly reducing revenues;
Reduction in business travel revenues, due to an increase remote
working and a substitution of business travel for virtual
meetings;
Changes in demand for certain routes as customers choose to
travel less / more locally in an effort to reduce their carbon
footprint, possibly reducing demand for long-haul vacation
travel and impacting LATAM’s strategy and destinations.
Results of the scenario analysis:
- 2025 [Low]: Around 21% of global consumers are expected to
prefer cleaner services and products.
- 2030 [Low]: A reduction in the aviation sector of 10% and
20% is expected by 2030 and 2050 respectively. Changes in the
2050: Moderate
August/ 2024
Página 13 de 42

Title
Report Aligned with the 11 TCFD recommendations
Version
1.0
way we work, live, and new technologies will also impact
demand for air services.
- 2050 [Moderate]: If SAFs cannot effectively enter into aviation,
an increase in air fares could be as high as 18% by 2050. It is
expected that in advanced economies, high-speed trains could
reduce demand for domestic flights of less than 1000 km by up
to 17%.
*For physical risks, a 4℃ scenario is used, whereas for transition risks, a 1.5℃ scenario was used. More information on the scenario analysis
methodology and approach is given in Section 2.3 below.
**For the risks of strong winds and coastal and riverine flooding, the absolute value for 2030 and 2050 was taken into account in determining
the rating (as opposed to change vs baseline used for the remaining hazards).
August/ 2024
Página 14 de 42

Title
Report Aligned with the 11 TCFD recommendations
Version
1.0
Table 4. Physical risks rating
Short-term
Risk*
Unit
Unity
Very low
Low
Moderate
High
Very high
Extreme
temperatures /
Heat waves
Annual maximum
temperature
°C
<28.8
≥28.8 and <32.3
≥32.3 and <35.8
≥35.8 and <40.1
>40.1
Days over 30°C
days
0
0 - 7
7 - 78
78 - 200
>200
Heavy rainfall
rx5day
mm
<40
40 - 54
54 - 73
73 - 112
>112
Coastal/Riverine
flooding
Flooding height
m
<0.1
≥0.1 and <0.25
≥0.25 and <0.5
≥0.5 and <1.6
≥1.6
Tropical cyclones
Saffir-Simpson scale
km/hr
119-153
154-177
178-209
210-249
>250
Strong winds
Maximum wind
speeds
m/s
<16.2
16.2 - 19.3
19.3 - 21.1
21.1 - 23.4
>23.4
Thunderstorms
rx1day
mm
<21
21 - 27
27 - 37
37 - 55
>55
Medium and long-term
Risk*
Unit
Unity
Very low
Low
Moderate
High
Very high
Extreme
temperatures /
Heat waves
Changes in the
annual maximum
temperature
°C
<1
≥1 and <2
≥2 and <3
≥3 and <4
≥4
Changes in the days
over 30°C
days
<3
≥3 and <7
≥7 and <14
≥14 and <21
≥21
Heavy rainfall
Changes in rx5day
%
<2
≥2 and <5
≥5 and <15
≥15 and <25
≥25
Coastal/Riverine
flooding
Flooding height
m
<0.1
≥0.1 and <0.25
≥0.25 and <0.5
≥0.5 and <1.6
≥1.6
Tropical cyclones
Changes in the
maximum tropical
cyclone velocity
(TCV)
%
<2.5
≥2.5 and <5
≥5 and <7.5
≥7.5 and <10
≥10
Strong winds
Maximum wind
speeds
m/s
<3
3 - 6
6 - 9
9 - 12
>12
Thunderstorms
Changes in rx1day
%
<2
≥2 and <5
≥5 and <15
≥15 and <25
≥25
August/ 2024
Página 15 de 42

Title
Report Aligned with the 11 TCFD recommendations
Version
1.0
Table 5. Transition risks rating
Risk
Very Low
Low
Moderate
High
Very High
Opportunity
Very Low
Low
Moderate
High
Very High
Short Term
Very little/no
importance of
climate
risk/opportunity
Little current
relevance of climate
risk/opportunity
Some significance of
climate
risk/opportunity due
to current trends
that may require
adjustments to
operations,
compliance or focus
on certain markets
High level of
significance of
climate
risk/opportunity due
to current trends
requiring substantial
changes to
operations,
compliance,
products, services or
business models
High level of
significance of
climate
risk/opportunity that
could potentially
cause
transformational
changes in
operations,
compliance,
products, services or
business models
Mid to Long Term
Very little or no
change in
risk/opportunity, e.g.
the policy, market,
technology
landscape will
remain the same as
in the baseline.
Little change in
risk/opportunity, e.g.,
policy, market,
technology
landscape will
remain similar to
baseline
Moderate changes in
risk/opportunity that
may require
adjustments to
operations,
compliance or
approach to certain
markets
Significant changes
that may require
substantial
adjustments to
operations,
compliance,
products, services or
business models.
Drastic changes that
require significant
changes to
operations,
compliance,
products, services or
business models
Very little or no
Little additional
Moderate costs will
Material costs will
Serious operational
August/ 2024
Página 16 de 42

Title
Report Aligned with the 11 TCFD recommendations
Version
1.0
additional costs will
be incurred over and
above current
impacts.
costs will be
incurred over and
above current
impacts.
occur related to
measures/actions
such as: investments
in new technologies,
energy efficiency
measures or
emission offsets.
be incurred with
direct impacts on the
finances.
or financial
dificulties arise with
significant costs with
a direct impact on
the finances.
August/ 2024
Página 17 de 42

Title
Report Aligned with the 11 TCFD recommendations
Version
1.0
● Impact of climate-related risks and opportunities on the organization’s businesses,
strategy, and financial planning.
As the aviation sector is highly exposed to physical and transition climate-related risks and
opportunities, direct and indirect impacts could adversely impact LATAM’s business and operations.
Changes in the climate patterns around the routes can impact and limit operations, affecting critical
infrastructure (airports), destinations, and communities in key geographies, and reducing the revenue
of the group and subsidiaries. Likewise, from the transition risk perspective, LATAM’s operations are
affected by local, national, and international regulations, which may require, among other things,
action to be taken in relation to the carbon footprint of the company and enhanced resource and
waste management. Mismanagement in all these aspects could have a detrimental effect on the
group's business and could require LATAM to implement mitigation measures in its operations, fleet,
routes, and destinations.
Environmental and social risks are identified and consolidated by the Corporate Affairs and
Sustainability Team and subsequently reported to the Risk Management Unit to be included in the
group's general risk matrix. Climate-related risks have been identified through this process and
included in the corporate risk management process. No other social and environmental risks relevant
to the operation were identified.
The sustainability team has a Business Plan, which includes the financial projections associated with
the development of the sustainability strategy.
● Resilience of the organization’s strategy, taking into consideration different
climate-related scenarios including a 2°C or lower scenario.
In 2024, LATAM will start to integrate the findings of the scenario analysis with respect to both
physical and transition risks and opportunities into the business strategy and financial planning,
enabling the enhancement and/or development of mitigation and/or adaptation actions that ensure
LATAM builds resilience to the risks identified, and can capitalize on any climate-related
opportunities.
Likewise, in the short- to medium-term, LATAM intends to update its sustainability strategy in order
to reflect material climate-related risks and opportunities that have been identified through the
TCFD-aligned scenario analysis. This may include strengthening LATAM’s climate-related risk
assessment and management processes; identifying and integrating additional climate-related
metrics and targets specific to material climate change risks and opportunities identified; and
expanding on LATAM’s efficiency and conservation and restoration initiatives.
August/ 2024
Página 18 de 42

Title
Report Aligned with the 11 TCFD recommendations
Version
1.0
3.3. Risk Management
● Organization’s processes for identifying and assessing climate-related risks.
LATAM’s uses several parallel systems and processes to help identify and assess climate-related
risks, including: 1) LATAM’s Integrated Safety Management System, which incorporates the Safety,
Security, Health, Safety and Environment (HSE) and the Emergency Response Plan, and includes a
process to periodically review and identify new/emerging risks. 2) LATAM’s monitoring systems used
in alignment with International Air Transport Association Environmental Assessment (IEnvA)
certification, whereby environmental (including climate) impacts are mapped as part of the risk
identification process; and 3) the identification, assessment and prioritization of climate-related risks
as identified in the TCFD-aligned climate risk and opportunity analysis undertaken in 2023.
The TCFD-aligned analysis of climate change risks and opportunities offers the most granular view of
LATAM’s exposure to climate risks, and the risk identification and assessment process (using scenario
analysis) is therefore described in more detail in this section.
The scenario analysis was performed in two stages. In the first stage, a baseline and scoping exercise
was undertaken with the objective of identifying a full list of potential climate change risks and
opportunities for LATAM, from which priority risks and opportunities would be explored in more
detail using scenario analysis (stage 2). In order to fully and holistically understand the
climate-related risks for LATAM, for the first stage, a set of meetings were held for each country
where LATAM has home markets (Brazil, Chile, Colombia, Ecuador and Perú). The objective was to
understand, from different perspectives within the company, the climate-related risks, based on the
unique understanding of each countries team, and taking into account their areas of expertise and
past knowledge in regards to past climate-related events. For each meeting, a key member of the
following teams participated:
● Sustainability
● Public Affairs
● Airports
● Ground / air operations
● Commercial / sales
This ‘long-list’ of climate risks and opportunities was developed by identifying all of the possible
climate-related transition and physical risks and opportunities that LATAM may be exposed to, and
assessing (at a high level) LATAM’s vulnerability to these. To support this assessment, several
sources of information were reviewed, including scientific literature, sectoral reports, competitors’
disclosures, and input from LATAM stakeholders, to map a comprehensive list of potential risks and
opportunities.
August/ 2024
Página 19 de 42

Title
Report Aligned with the 11 TCFD recommendations
Version
1.0
More than 20 physical risks and 30 transition risks and opportunities were identified in this initial
baseline and scoping phase, and the most relevant and potentially material ones were highlighted
and rated according to LATAM’s vulnerability as well as the expected level of change under the
climate change scenarios in question (+1.5℃ and +4℃ for transition and physical risks, respectively).
The top prioritized risks and opportunities were discussed during a prioritization session with a
cross-section of LATAM stakeholders, who were able to provide a comprehensive perspective on the
potential impacts of the identified risks on LATAM's business strategy. Following this, a final list of
twelve priority risks and opportunities was agreed on for further assessment during the scenario
analysis.
In the second stage, scenario analysis was used to assess the prioritized risks and opportunities
across two climate scenarios and three time horizons. The time horizons considered for physical
climate risks were 2025 (short term/baseline), 2030 (medium term) and 2050 (long term), as
changes for physical climate changes are expected to materialize more strongly during the next
decades, especially from the middle to the end of the century. Similarly, the time horizons assessed
for the transition risk assessment were 2025 (short term/baseline), 2030 (medium term) and 2050
(long term), with a greater focus on the near-to-medium term, as there can be more uncertainty in
both the evolution of both the business and operations, and climate and energy-related policies
under certain climate scenarios, beyond 2030.
Transition risks and opportunities
The analysis of the transition risks and opportunities considered climate-related risks and
opportunities across four main areas: current regulation / emerging regulation and legal risk,
technology risk, market risk, and reputational risk. The geographical areas in scope were South
America, North America, Europe, and global.
Physical risks
The analysis of physical climate change risks considered two categories of risks: acute and chronic.
Acute physical risks refer to event-driven changes, for example, extreme weather such as cyclones,
floods, and landslides, whereas chronic physical risks reflect longer-term shifts in climate patterns,
for example, an increase in the frequency of droughts. The geographical locations considered for this
analysis were the countries with key sites, routes, or hubs for LATAM’s operations: Argentina, Brazil,
Ecuador, Colombia, Peru, Bolivia, Uruguay, Paraguay, Dominican Republic, The Bahamas, United
States, Chile, Mexico, and Spain
The climate scenarios that were used as a basis for the analysis are presented in Table 6.
August/ 2024
Página 20 de 42

Title
Report Aligned with the 11 TCFD recommendations
Version
1.0
Table 6. Scenarios assessed during the climate risk assessment
Type of
scenario
Scenario
Temperature
change by
2100
Description
Selection of
scenarios
Physical
risks
SSP5-8.5
+4℃ (3.3–
5.7℃)
This represents a
‘worst-case’ warming
scenario, with global
mean temperature
increases of >4℃ by the
end of the century
compared to preindustrial
levels bringing significant
changes to climate and
weather patterns
The IPCC’s
SSP5-8.5 scenario
was considered in
the analysis, as it
aligns with TCFD's
recommendations
by representing an
extreme (‘worst
case’) future in the
spectrum of
potential futures
Transition
risks
1.5℃-aligne
d
1.5℃
This represents a
‘best-case’ climate
change scenario where
stringent climate policies
and carbon pricing limit
global temperature
increases to ~1.5℃ to
1.7℃ by end-century.
The International Energy
Agency’s Net Zero
Emissions by 2050 (NZE)
is used as the main
scenario, with
information from regional
scenarios used where
NZE scenario information
is not available
This scenario is
based on the IEA
scenarios, which
are in line with the
TCFD
recommendations,
as well as being
well-known and
widely used, and
represents a ‘rapid
low-carbon
transition scenario’
with significant
policy/legal,
market, technology
and reputational
changes
Based on the scenario projections, risks and opportunities were rated as very high, high, moderate,
low, very low, or uncertain, with definition of the rating varying depending on the timeframe in
question:
August/ 2024
Página 21 de 42

Title
Report Aligned with the 11 TCFD recommendations
Version
1.0
● Short-term / baseline (2025): The rating assigned for the short-term/baseline (2025) time
horizon represents the absolute rating of the risk, which considers its current criticality and
relevance for LATAM’s operations.
● Medium- and long-term (2030 and 2050): The rating assigned to the medium (2030) and
long-term (2050) time horizons represents the magnitude of change in the risk / opportunity
under the scenario in question compared to the baseline (2025).
● Organization’s processes for managing climate-related risks.
As of 2022, LATAM has undertaken several initiatives to manage climate-related risks and enhance
the sustainability and environmental performance of the group. In particular, the following initiatives
help us to manage some of the climate change transition risks assessed above: the monitoring of
environmental measures concerning the GHG footprint, the use and implementation of sustainable
aviation fuels (SAFs), and improving circularity in the use of resources.
● Processes for identifying, assessing, and managing climate-related risks are integrated
into the organization’s overall risk management.
LATAM has already identified climate-related risks and opportunities, specifically linked to the air
transport industry; however, non-climate-related risks are already integrated into the company's
general risk management after being consolidated by the Corporate Affairs and Sustainability Team.
The Risk Management Unit is reviewing the assessment of the climate-related risks and
opportunities and is planning to include (as required) the results and findings of the identified
climate-related risks and opportunities in LATAM’s general risk management system.
From 2024 onwards LATAM intends to carry out an annual process to identify, assess, prioritize, and
integrate climate-related risks as part of the Integrated Safety Management System. The general
process for risk management is outlined in the section above.
3.4. Metrics and targets
● Metrics used by the organization to assess climate-related risks and opportunities in line
with its strategy and risk management process.
Within the sections ‘Commitment with the future’ and the sub-sections ‘climate change and
environmental management’, and ‘eco-efficiency’ in our integrated report, LATAM discloses
climate-related metrics and targets to measure and monitor material risks, and has initiated corporate
programs to improve the use of resources and reduce its carbon footprint. Data related to the GHG
emissions broken down by Scope can be found in the ‘Metrics & targets’ section of this document,
with additional climate-related metrics currently being tracked presented in Table 7.
August/ 2024
Página 22 de 42

Title
Report Aligned with the 11 TCFD recommendations
Version
1.0
Table 7. Overview of LATAM’s key climate-related metrics
Metric
Overview
2020
2021
2022
Emissions
intensity
Emissions intensity in the total
operation
Measured in kg CO
2
e/100 RTK
(Revenue tonne-kilometer)
Tracked since 2013
76.87
80.76
101.80
Emissions
intensity
Emissions intensity in the air
operations
Measured in kg CO
2
e/100 RTK
(Revenue tonne-kilometer)
Tracked since 2013
76.31
80.55
76.67
Energy intensity
Energy intensity from ground and
air operations
Measured in MWh/RTK (Revenue
tonne-kilometer)
Tracked since 2013
1.4
2.2
1.7
Atmospheric
(non-CO
2
) GHG
emissions
Produced emissions of NO
x
Measured in tonnes
Tracked since 2013
19,207
22,184
33,198
Atmospheric
(non-CO
2
) GHG
emissions
Produced emissions of SO
x
Measured in tonnes
Tracked since 2013
851
983
1,470
Internal energy
consumption
(non-renewable)
Total fuels and electricity from
non-renewable sources
Measured in Terajoules (TJ)
Tracked since 2013
76,970.35
88,993.70
134,251.7
2
Internal energy
consumption
(renewable)
Ethanol and electricity from
renewable sources
Measured in TJ
Tracked since 2016
77,076.18
89,112.08
134,436.7
1
Water
withdrawn
Water withdrawn from municipal
networks
Measured in m
3
Tracked since 2013
82,480
98,846
85,656
Waste
Total waste (hazardous and
6,583
28,803
37,990
August/ 2024
Página 23 de 42

Title
Report Aligned with the 11 TCFD recommendations
Version
1.0
management
non-hazardous)
Measured in tonnes
Tracked since 2013
● Scope 1, Scope 2, and if appropriate, Scope 3 greenhouse gas (GHG) emissions, and the
related risks.
Measuring the carbon footprint of LATAM Airlines Group S.A.'s operations is a key part of the group's
sustainability strategy, and since 2012 the group has been accounting for emissions in accordance
with the ISO 14064 standard and the Greenhouse Gas Protocol framework. The descriptions of
emissions sources included in each Scope are outlined in Table 8, and the results of the GHG
accounting for 2022, and the prior three reporting years, are disclosed in Table 9.
Table 8. Description of each GHG emissions scope
Scope
Description
Scope 1
Emissions directly generated from sources owned or controlled by LATAM
Scope 2
Emissions generated by the generation of purchased electricity
Scope 3
Emissions indirectly generated as a result of the activities of the company
from sources that the company does not own or control
August/ 2024
Página 24 de 42

Title
Report Aligned with the 11 TCFD recommendations
Version
1.0
Table 9. LATAM’s GHG emissions for 2019–2022 divided by scope, in tonnes of CO
2
equivalent
Scope
Sub-category
2019
2020
2021
2022
Scope 1
Direct
emissions
12,149,72
5
5,614,368
6,497,576
9,780,288
Scope 2
Indirect
emissions
18,423
16,355
14,549
7,150
Scope 3
(total)
Other indirect
emissions
218,174
24,827
2,446
3,198,317
Scope 3
Category 1
(Purchased
goods and
services)
N/A
N/A
N/A
1,100,644
Scope 3
Category 2
(Capital goods)
N/A
N/A
N/A
N/A
Scope 3
Category 3
(Fuel & energy
related
activities)
(passengers)
N/A
N/A
N/A
1,836,131
Scope 3
Category 3
(Fuel- and
energy-related
activities)
(cargo)
N/A
N/A
N/A
194,578
Scope 3
Category 4
(Upstream
transportation
and
distribution)
N/A
N/A
N/A
37,637
Scope 3
Category 5
(Waste
generated in
operations)
N/A
N/A
N/A
2,091
Scope 3
Category 6
N/A
N/A
N/A
14,582
August/ 2024
Página 25 de 42

Title
Report Aligned with the 11 TCFD recommendations
Version
1.0
(Business
travel)
Scope 3
Category 7
(Employee
commuting)
N/A
N/A
N/A
12,364
Scope 3
Category 9
(Downstream
transportation
and
distribution)
N/A
N/A
N/A
N/A
Total (Scope
1, 2 &3)
N/A
12,386,32
3
5,655,551
6,514,570
12,985,755
Emissions
compensated
(LATAM)
N/A
N/A
N/A
N/A
572,782
Emissions
compensated
(clients)
N/A
N/A
N/A
N/A
33,184
According to the group's GHG inventory, the company has seen a 20% decrease in Scope 1
emissions compared to the base year of 2019, reaching 9,780,288 tonnes of CO2 equivalent in 2022,
in addition to reporting an amount of compensated emissions of around 572,782 thousand tonnes of
CO2 equivalent, through carbon credits. Likewise, by 2022 the emissions inventory reported a total
of 12,985,755 uncompensated emissions, of which Scope 1 accounts for 75.3%, Scope 2 for 0.1%,
and Scope 3 for 24.6% of the total.
Post-pandemic (2022), an increase in Scope 1 net emissions was observed due to the recovery of
operations in all countries. However, emissions intensity in air operations was reduced by 4.8%
compared to 2021, demonstrating the effectiveness of activities to improve operational efficiency
including under the Fuel Efficiency framework, LATAM's Fuel Efficiency program, initiatives
implemented included the optimization of routes and flight plans, implementation of Descent Profile
Optimization (DPO), and rationalization of the use of the auxiliary engine.
For the year 2022, as part of the process of continuous improvement in the calculation of the GHG
footprint, the granularity of Scope 3 accounting was increased, incorporating five new categories in
all countries, throughout the value chain. There are a total of seven categories included in the Scope
3 footprint: indirect emissions from land transportation related to operations (employees, suppliers,
August/ 2024
Página 26 de 42

Title
Report Aligned with the 11 TCFD recommendations
Version
1.0
and waste), air travel (in other companies) of employees in work activities, purchase of goods and
services, capital goods, emissions related to fuel and energy (cargo and passengers), waste
generated in the operation, and emissions generated by indirect transportation (performed by an
external supplier). In previous years (2019 to 2021), only indirect emissions from ground
transportation related to operations (employees, suppliers, and waste) and air travel (in other
companies) of employees in work activities, respectively, were considered for this scope. Scope 3
categories 8 to 12 are excluded as they are not applicable to LATAM, except for operations in Brazil
where category 9 (downstream transport and distribution) applies. However, categories 13 to 15, as
part of the company's continuous improvement process, are expected to be reviewed for their
eventual applicability.
● Targets used by the organization to manage climate-related risks and opportunities and
performance against targets.
LATAM’s climate objectives are currently focused on reducing the carbon and waste footprint, and
improving energy and fuel efficiency across all LATAM operations. LATAM has therefore established
the following climate-related targets:
● Achieve carbon neutrality in air and land operations by 2050
● Be zero waste to landfill by 2027
● Reduce by 95% the use of single-use plastics across all LATAM operations by 2023
LATAM has also begun to implement water saving initiatives, starting with a communication
campaign for the saving and efficient use of resources (including corporate buildings and
maintenance).
4. Annexes
4.1. Detailed images/maps of physical risks
For the physical risk levels described in this Annex, the medium term refers to the year 2030 and the
long term to 2050.
August/ 2024
Página 27 de 42

Title
Report Aligned with the 11 TCFD recommendations
Version
1.0
Risk Level - Maximum Temperatures
Comparison of maximum temperature indicator risk levels at LATAM Airlines' main airports for
medium and long term, under a high emissions scenario.
Risk Level - Days exceeding 30°C
Comparison of risk levels of the indicator of number of days exceeding 30°C at LATAM Airlines' main
airports for the medium and long term, under a high emissions scenario.
August/ 2024
Página 28 de 42

Title
Report Aligned with the 11 TCFD recommendations
Version
1.0
Risk Level - Coastal flood height
Comparison of the average coastal flooding height at LATAM Airlines' main airports for the medium
and long term, under a high emissions scenario.
Risk Level - Riverine flood height
Comparison of average riverine flood heights at LATAM Airlines' main airports for the medium and
long term, under a high emissions scenario.
August/ 2024
Página 29 de 42
Title
Report Aligned with the 11 TCFD recommendations
Version
1.0
Risk Level - rx5day
Comparison of the risk levels of the five consecutive days with the highest rainfall at LATAM Airlines'
main airports for the medium and long term, under a high emissions scenario.
Risk Level - rx1day
Comparison of annual maximum rainfall risk levels at LATAM Airlines' main airports for the medium
and long term, under a high emissions scenario.
August/ 2024
Página 30 de 42

Title
Report Aligned with the 11 TCFD recommendations
Version
1.0
Risk Level - Annual maximum speeds
Comparison of risk levels of annual maximum speeds at LATAM Airlines' main airports for the
medium and long term, under a high emissions scenario.
Risk Level - Tropical cyclone velocity (TCV)
Comparison of risk levels of maximum tropical cyclone velocities at LATAM Airlines' main airports for
the medium and long term, under a high-emission scenario.
August/ 2024
Página 31 de 42

Title
Report Aligned with the 11 TCFD recommendations
Version
1.0
4.2. Detailed results of physical scenarios by airport
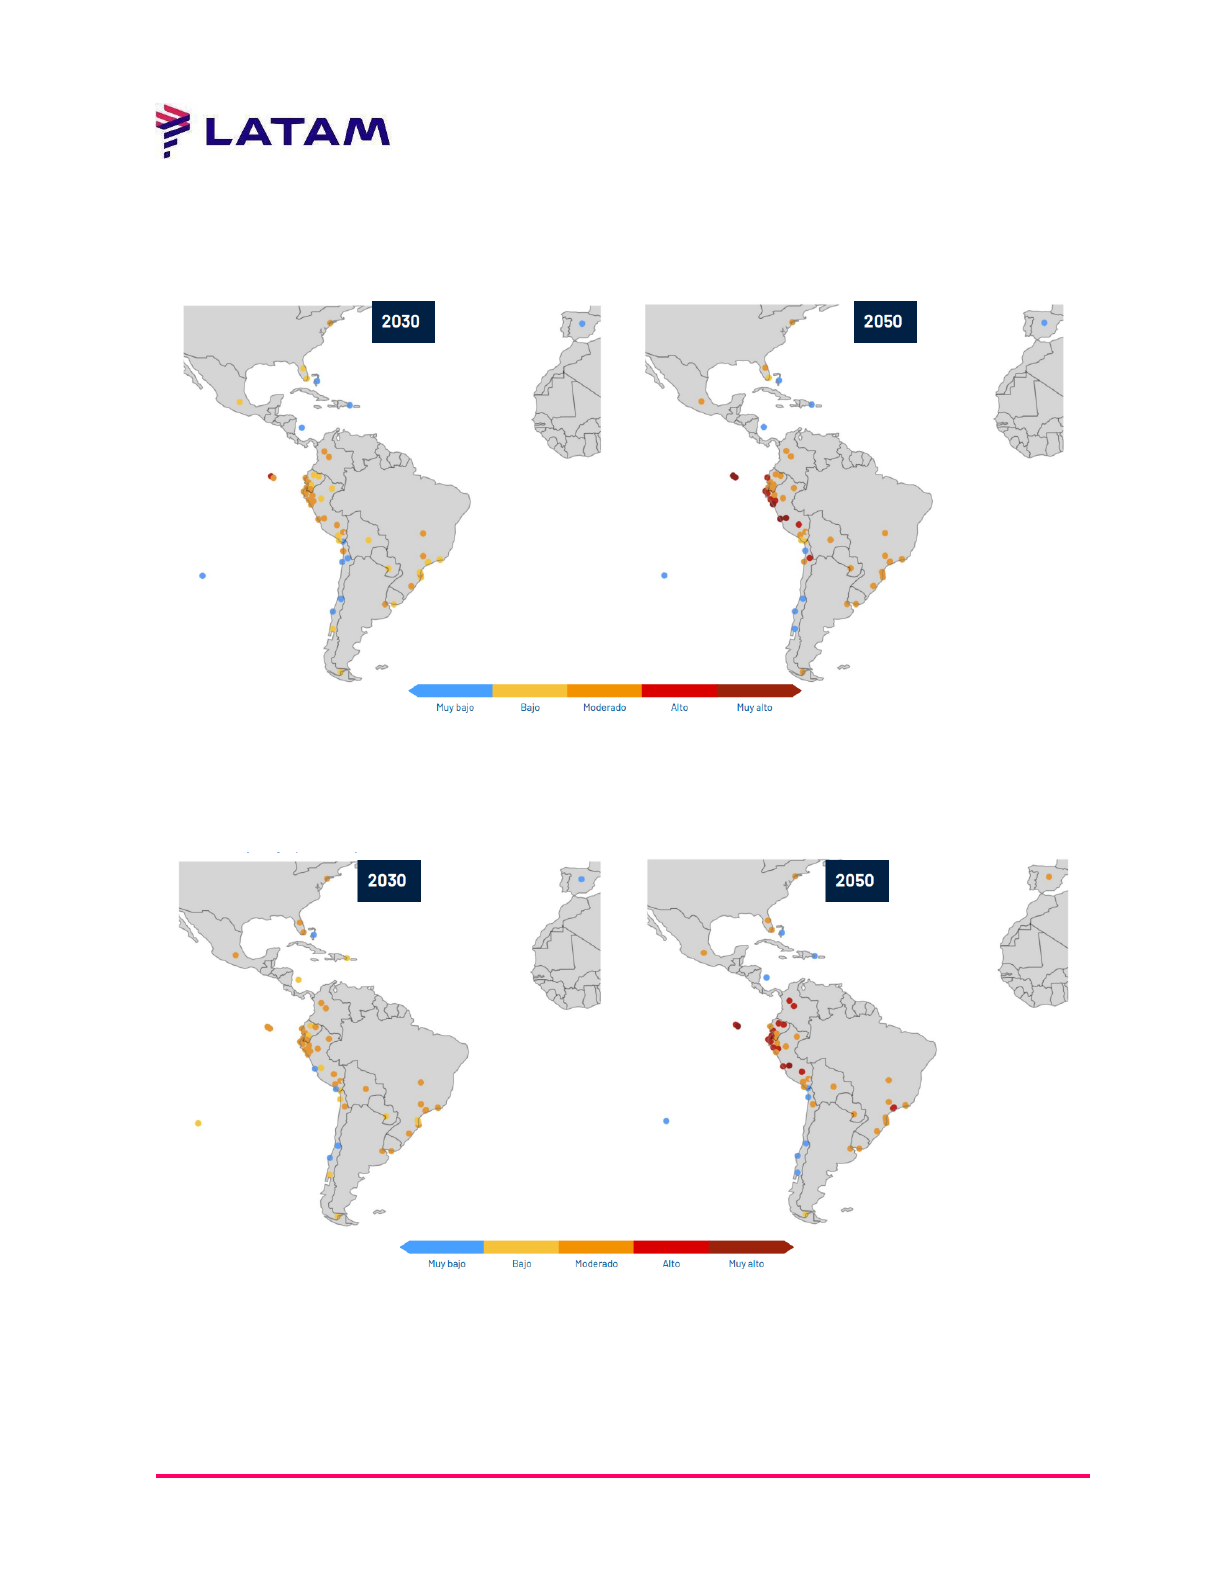
2030: Extreme Temperatures / Heat Waves
Changes in annual maximum temperature
August/ 2024
Página 32 de 42

Title
Report Aligned with the 11 TCFD recommendations
Version
1.0
2050: Extreme Temperatures / Heat Waves
Changes in annual maximum temperature
August/ 2024
Página 33 de 42

Title
Report Aligned with the 11 TCFD recommendations
Version
1.0
2030: Extreme Temperatures / Heat Waves
Changes in the number of days exceeding 30°C
2050: Extreme Temperatures / Heat Waves
Changes in the number of days exceeding 30°C
August/ 2024
Página 34 de 42

Title
Report Aligned with the 11 TCFD recommendations
Version
1.0
Coastal Flooding
Flood height (m)
August/ 2024
Página 35 de 42

Title
Report Aligned with the 11 TCFD recommendations
Version
1.0
Riverine Flooding
Flood height (m)
August/ 2024
Página 36 de 42

Title
Report Aligned with the 11 TCFD recommendations
Version
1.0
2030: Heavy rainfall
Relative changes in rx5day (%)
2050: Heavy rainfall
Relative changes in rx5day (%)
August/ 2024
Página 37 de 42

Title
Report Aligned with the 11 TCFD recommendations
Version
1.0
2030: Thunderstorms
Relative changes in rx1day (%)
August/ 2024
Página 38 de 42

Title
Report Aligned with the 11 TCFD recommendations
Version
1.0
2050: Thunderstorms
Relative changes in rx1day (%)
August/ 2024
Página 39 de 42

Title
Report Aligned with the 11 TCFD recommendations
Version
1.0
2030: Strong winds
Annual maximum wind speed
August/ 2024
Página 40 de 42

Title
Report Aligned with the 11 TCFD recommendations
Version
1.0
2050: Strong winds
Annual maximum wind speed
August/ 2024
Página 41 de 42

Title
Report Aligned with the 11 TCFD recommendations
Version
1.0
Tropical cyclones
Change in tropical cyclone speed
August/ 2024
Página 42 de 42
