
Canvas Course Statistics
Course Statistics give you a glimpse into which Assignments, Discussions, and Quizzes are engaging
students and what might be improved in the future. It will also help you to detect which students are
not participating to the fullest or have started to fall behind the rest of the class.
Accessing Basic Course Statistics
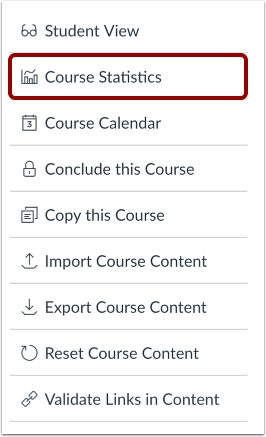
1. In your course, click the Settings tab.
2. Click the Course Statistics link.
In the Totals tab, view running totals of
course discussions, assignments, active
students, and quizzes.
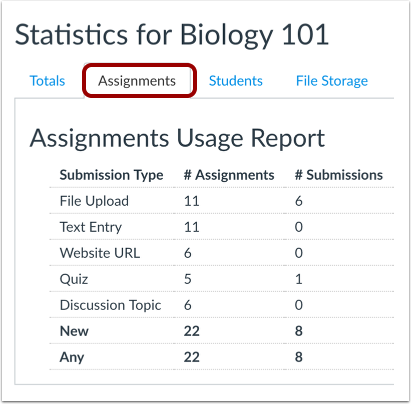
In the Assignments tab, you can view statistics about
assignments in your course including the submission
type, number of assignments, and number of
submissions.
In the Students tab, you can view the
students who have recently logged in to
Canvas.
In the File Storage tab, you can view the allotted
storage for your course, the number uploaded files,
and the number of unique media files in your course.

Quiz Statistics
You can view quiz statistics for quizzes that have been published and have at least one submission. You
can also download comma separate value (CSV) files to view Student Analysis or Item Analysis for each
quiz question.
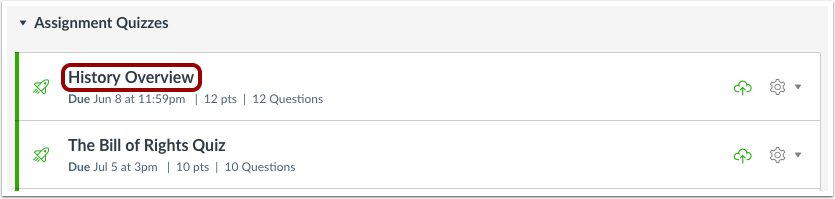
1. In Course Navigation, click the Quizzes link.
2. Click the title of the quiz you want to open.
3. Click the Quiz Statistics link.
Note: Quiz Statistics will not be available until at least one student has completed the quiz. If a student
had multiple assignment attempts, you can view past attempts in SpeedGrader. Quiz stats will only
display the kept score for the student (highest score or latest score). To view the score setting for
multiple attempts, edit your quiz and view the multiple attempts settings option. If necessary, you can
give your students an extra attempt.
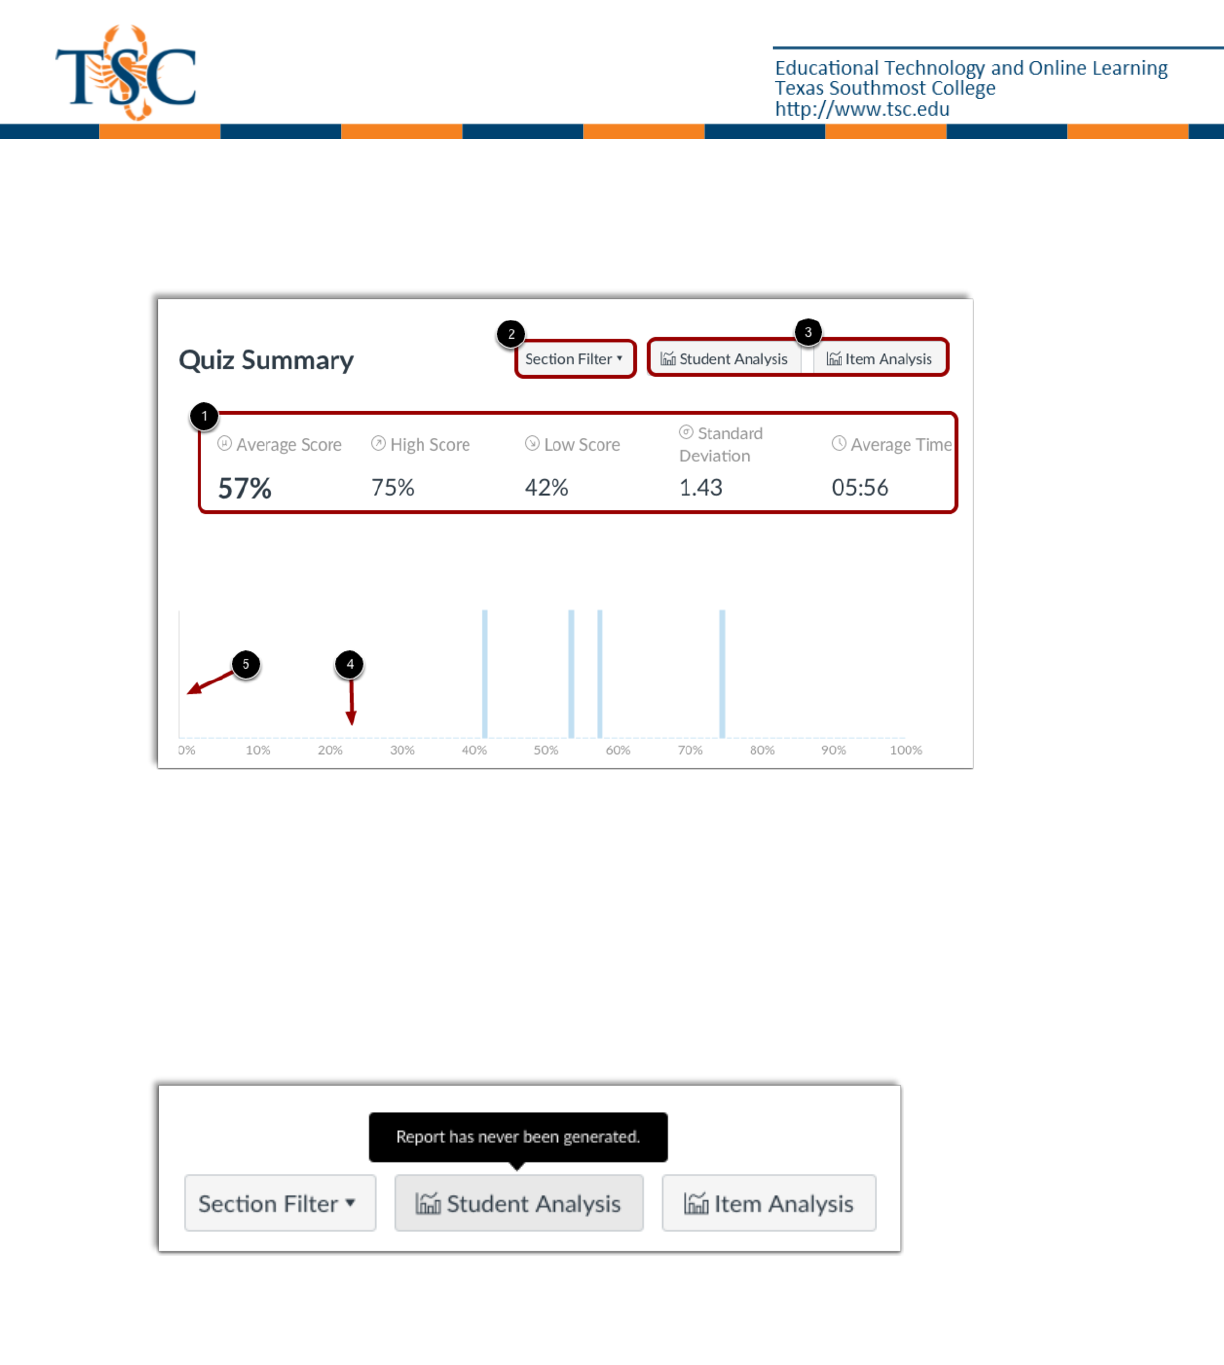
Quiz Statistics Summary
By default, the quiz summary shows statistics for all sections including the quiz average score, high
score, low score, standard deviation (how far the values are spread across the entire score range), and
average time of quiz completion [1].
To view quiz statistics for a section, click the Section Filter drop-down menu [2]. To access additional
survey results, generate a Student/Item Analysis report [3].
In the summary graph, the x-axis indicates the quiz scored percentages [4], and the y-axis indicates the
number of students who received each percentage [5].
View Analysis Reports
When instructors generate an analysis report, Canvas shows the last time the report was generated. If
there is an error with the report, instructors can retry the option or cancel the analysis completely.
Download CSV files to view Student Analysis or Item Analysis for each quiz question to count all student
attempts in the statistics.

View Question Breakdown
Quiz question shows the total percentage of students who answered the quiz question correctly [1].
Each question includes a breakdown with each question answer choice. Correct answer response(s) are
shown in a green bar with a check mark [2]; incorrect responses are shown in a black bar [3].
Question types that do not have set answer choices, such as Fill-in-the-Blank questions, display entries
other than the correct answer in a black striped bar [4]. The horizontal bars are scaled according to the
answer response percentage [5].
Each response also displays the number of respondents who selected the answer [6]. To view the names
of the students who selected an answer choice, click the [x respondents] link.

View Manually Graded Questions
Quiz statistics also show relative grade performance for manually graded essay and file upload quiz
question types. Manually graded question types are shown in the same table format as other quiz types.
A manually graded quiz type is marked as correct if it contains a student score greater than or equal to
the question points possible.
Grade breakdown responses are shown as the top 27% [1], middle 46% [2], and bottom 27% [3]. The
statistics also show submissions that have not yet been graded [4]. However, if all scores are identical, a
response category may show more than the percentage number of students (e.g., all students score
100%).
Manually graded questions also include access to SpeedGrader for quick reference [5].
